
Image caption
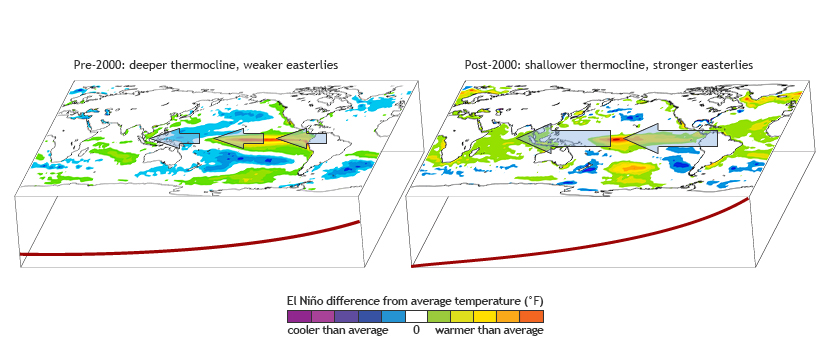
Figure 1: Schematic of average thermocline position and easterly winds, pre-2000 (left) and post-2000 (right). Shading shows average sea surface anomalies during El Niño events in each of the two periods. Figure by climate.gov.
Figure 1: Schematic of average thermocline position and easterly winds, pre-2000 (left) and post-2000 (right). Shading shows average sea surface anomalies during El Niño events in each of the two periods. Figure by climate.gov.