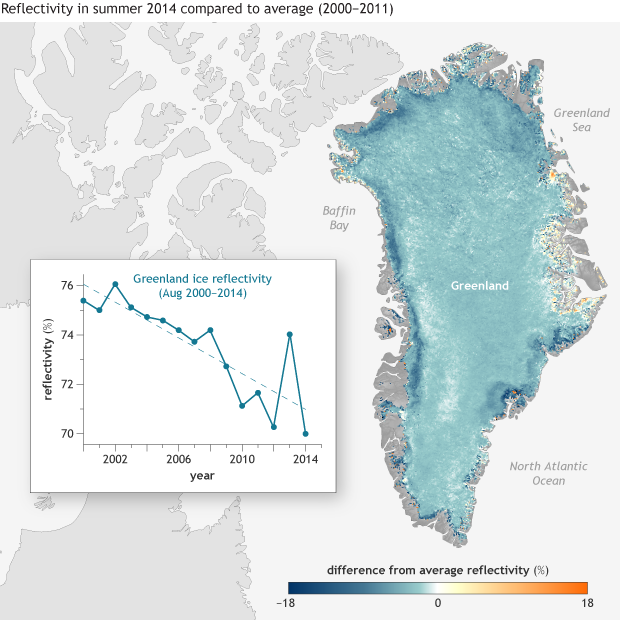
File name: GreenlandReflectivity_composite_620.png Original Resolution (pixels): 620 × 620 File Size: 212 KB (MIME Type: image/png) Date Published: April 13, 2022 Alternate Text: Infographic showing a map of ice reflectiveness on Greenland combined with a line graph inset showing decline in summer ice albedo from 2000 to 2014 View image full size Download file
