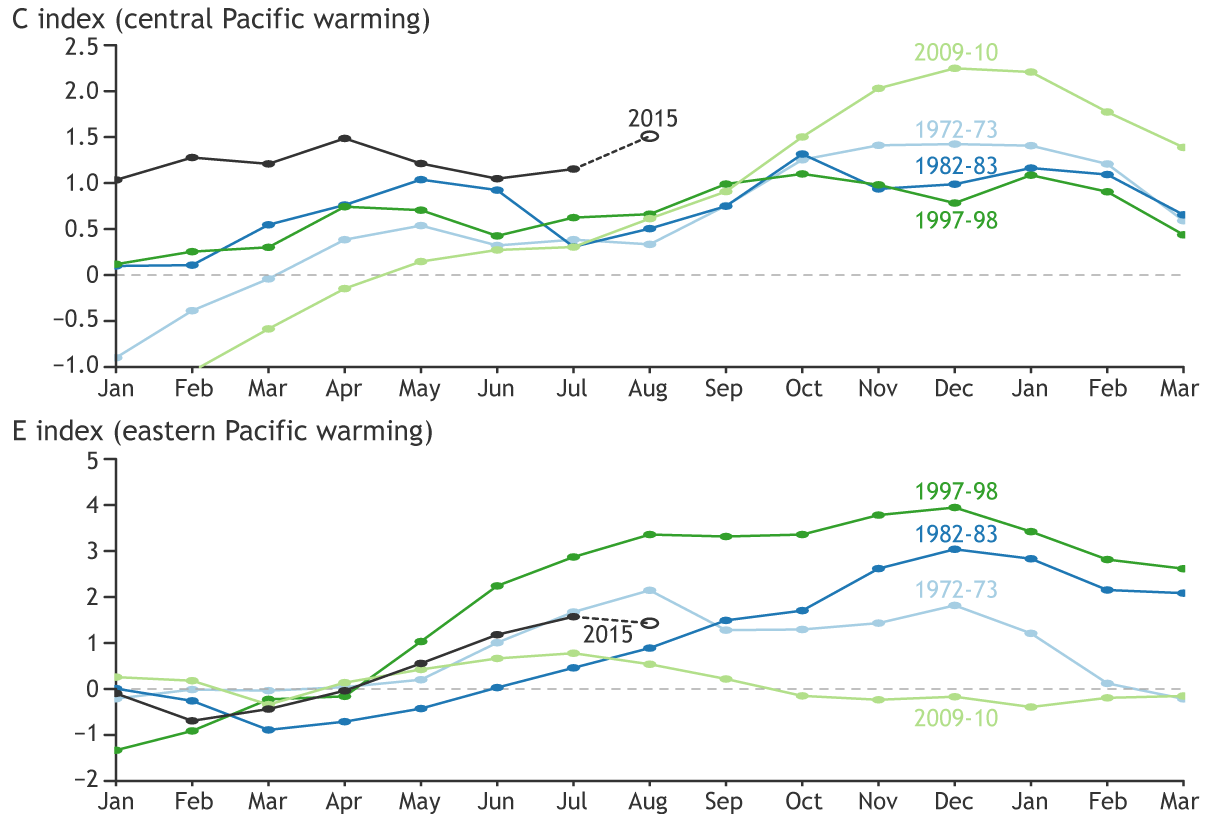
Image caption
(top panel) Central Pacific (C) and (bottom panel) eastern Pacific (E) monthly SST indices during selected El Niño events and the current year. The estimated values for August 1-19, 2015, are indicated with an open circle.
(top panel) Central Pacific (C) and (bottom panel) eastern Pacific (E) monthly SST indices during selected El Niño events and the current year. The estimated values for August 1-19, 2015, are indicated with an open circle.