
Image caption
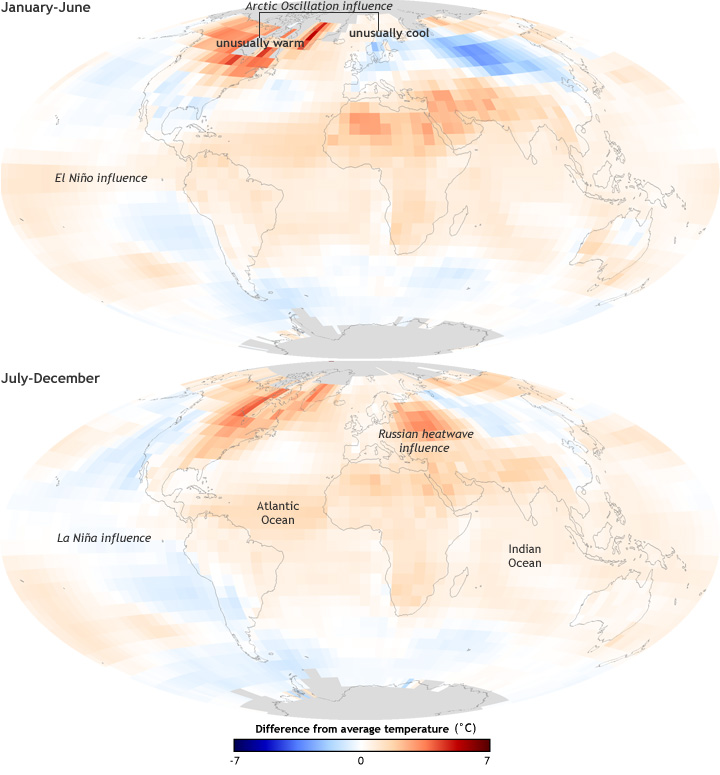
Maps of global surface temperature anomaly from January-June 2010 (top) and July-December (bottom). Based on Global Historical Climatology Network data from NCDC.
Maps of global surface temperature anomaly from January-June 2010 (top) and July-December (bottom). Based on Global Historical Climatology Network data from NCDC.