This website is an ARCHIVED version of NOAA Climate.gov as of June 25, 2025. Content is not being updated or maintained, and some links may no longer work.
File: SSTA_Forecast_Map_large.png
File name: SSTA_Forecast_Map_large.png
Original Resolution (pixels): 1240 × 913
File Size: 220 KB (MIME Type: image/png)
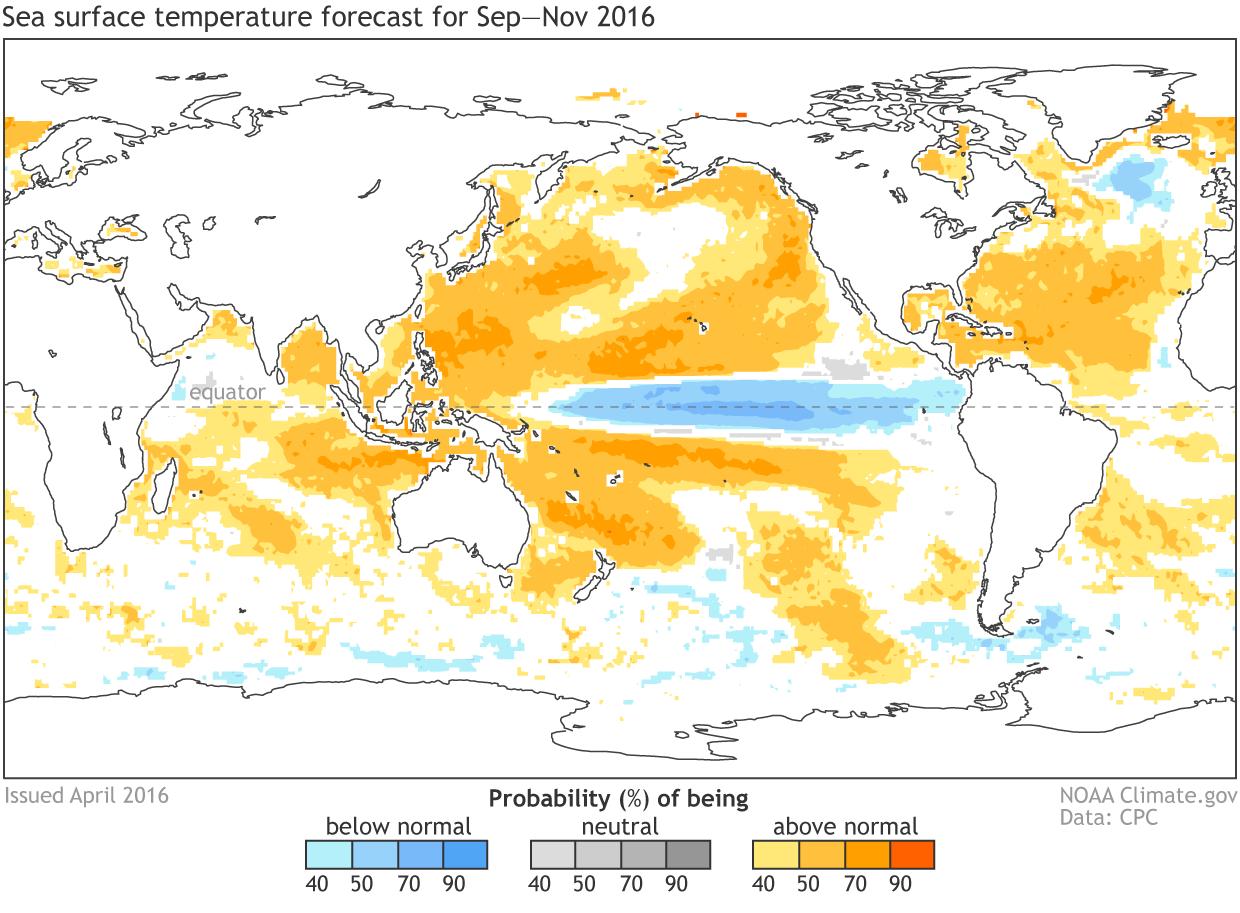
Alternate Text: Map of sea surface temperature forecast for the September-November period. Blues over the equator indicate a forecast la Nina while the rest of the Pacific, Indian and Atlantic ocean are orange indicating warmer than average temperatures.