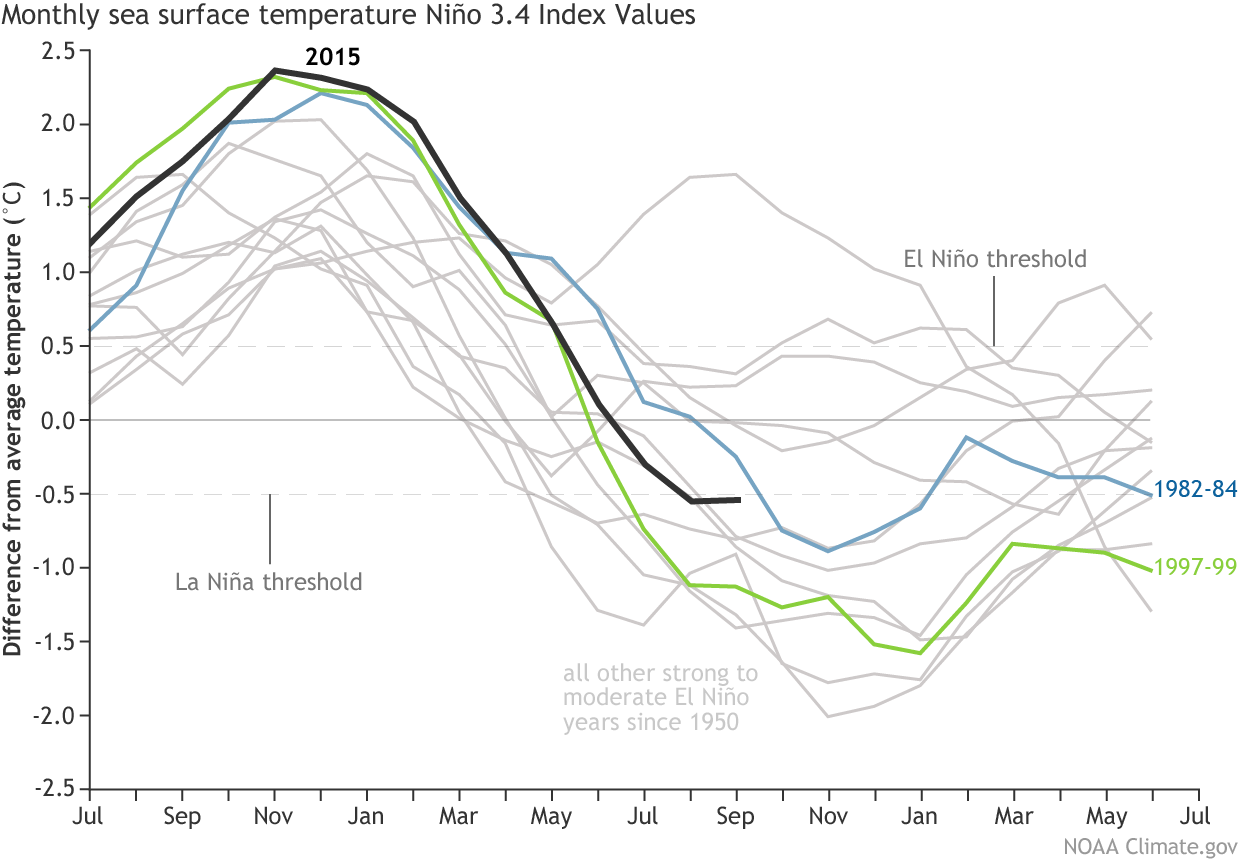
File name: ENSOforecast_Sep2016_1240.png Original Resolution (pixels): 1240 × 866 File Size: 157 KB (MIME Type: image/png) Date Published: October 13, 2016 Alternate Text: Line graph showing how ocean temperatures in the Nino3.4 region compared for all moderate to strong El Nino years since 1950. The black line for 2015-2016 shows that this event was similar to past events in its progression. View image full size Download file
