
Image caption
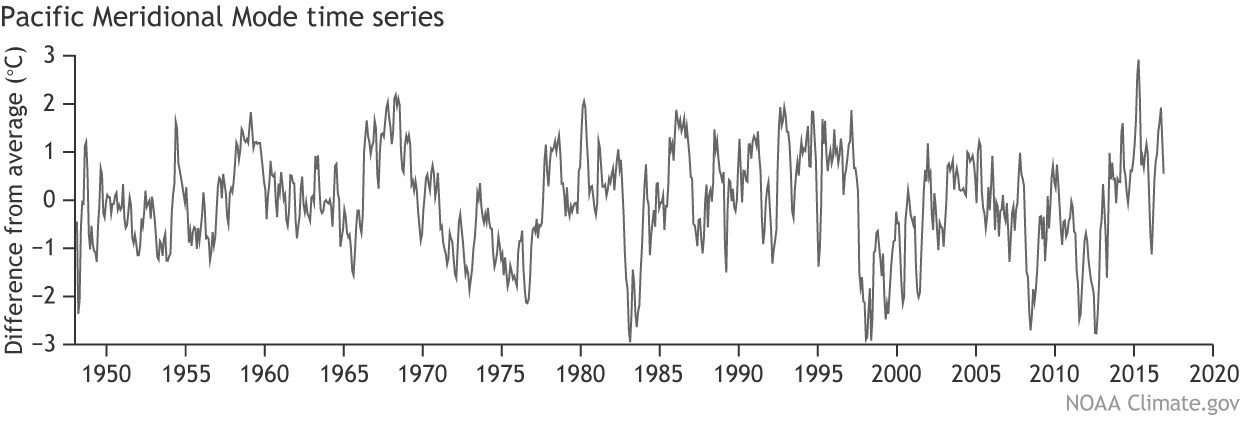
Fig. 3: Time series of the Pacific Meridional Mode. Positive values are related to the positive state of the Pacific Merdional Mode (related patterns are shown in the previous figures). Figure provided by Dan Vimont (index updated here: http://www.aos.wisc.edu/~dvimo