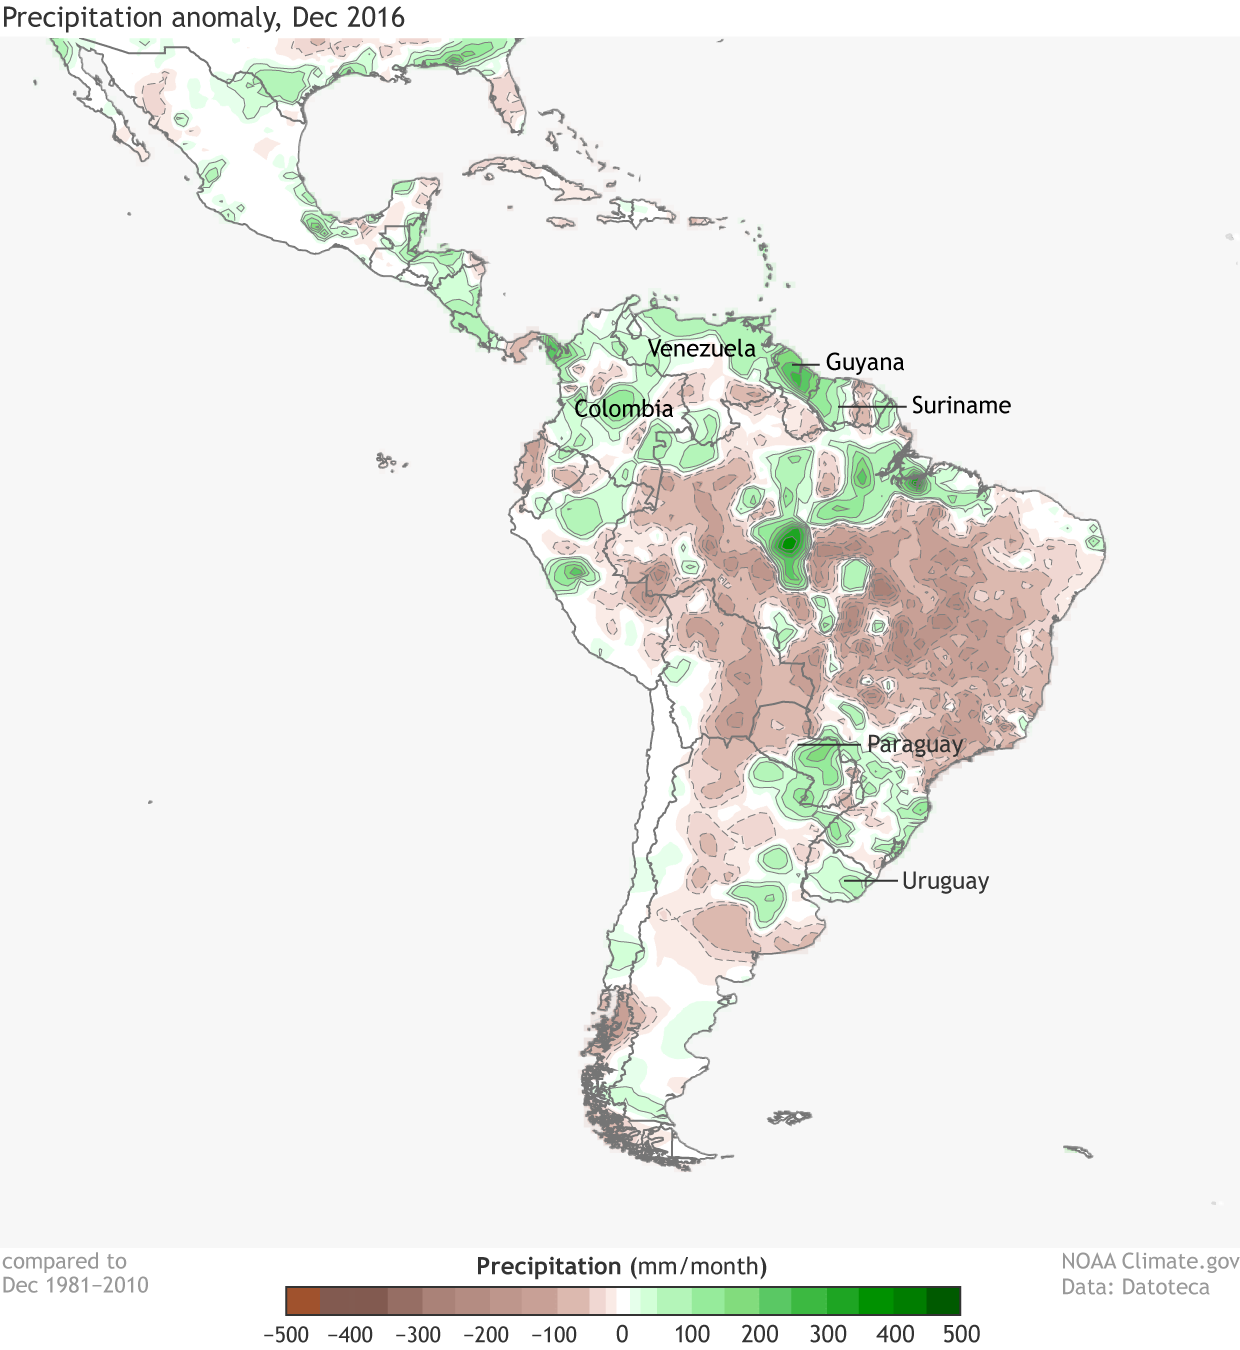
Image caption
Rainfall anomalies (mm per month) observed in December 2016; green colors correspond to above-normal rainfall (opposite for brown colors). Normal is computed with respect to the period 1981-2010.
Rainfall anomalies (mm per month) observed in December 2016; green colors correspond to above-normal rainfall (opposite for brown colors). Normal is computed with respect to the period 1981-2010.