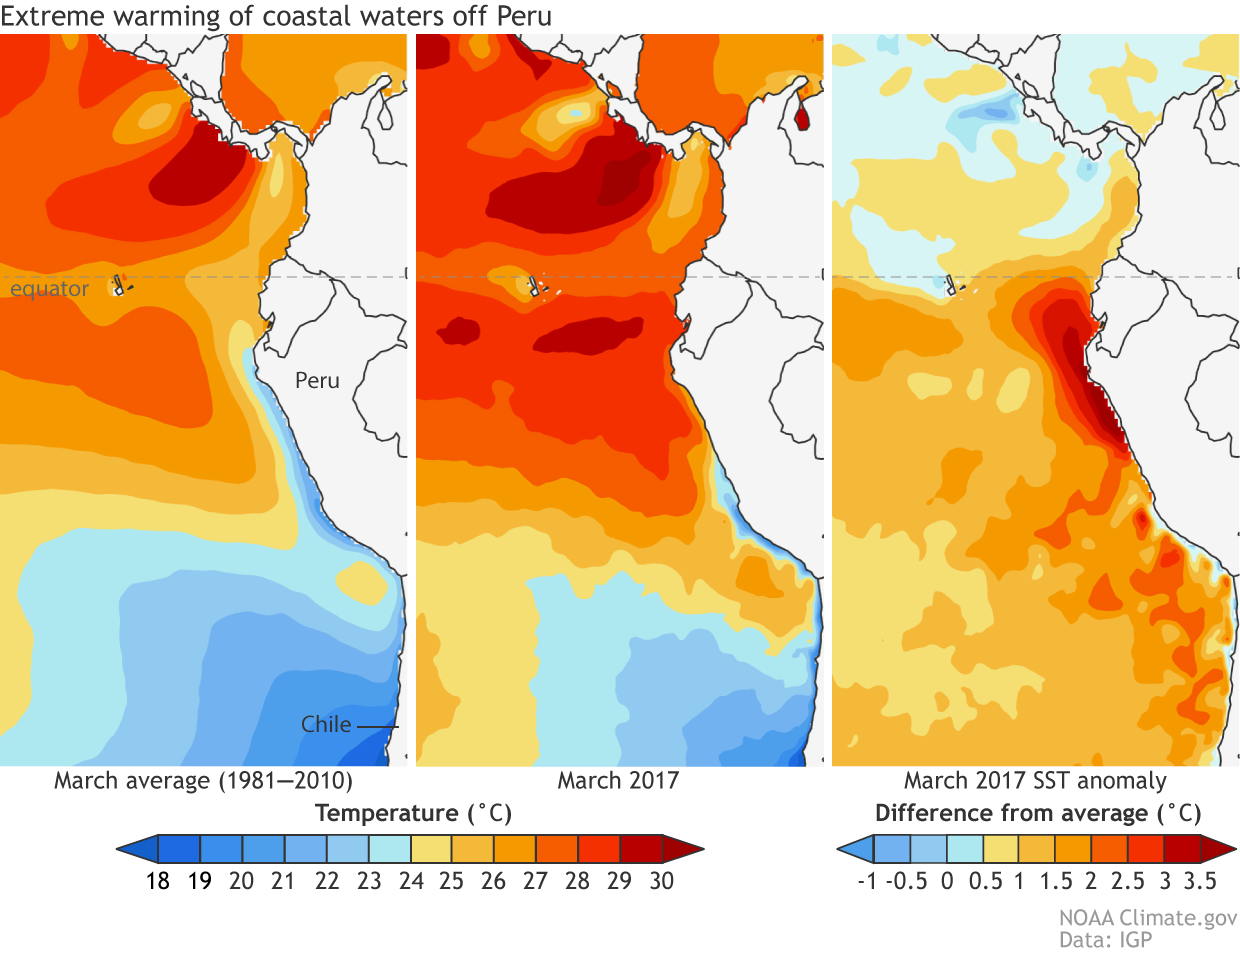
File name: March-SST-2017panels_1240.png Original Resolution (pixels): 1240 × 954 File Size: 387 KB (MIME Type: image/png) Date Published: April 13, 2017 Alternate Text: Three maps showing average sea surface temperatures in the eastern Pacific during March (from left to right) on average from 1981-2010, for March 2017 and the difference between the two. March 2017 was much warmer. View image full size Download file
