
Image caption
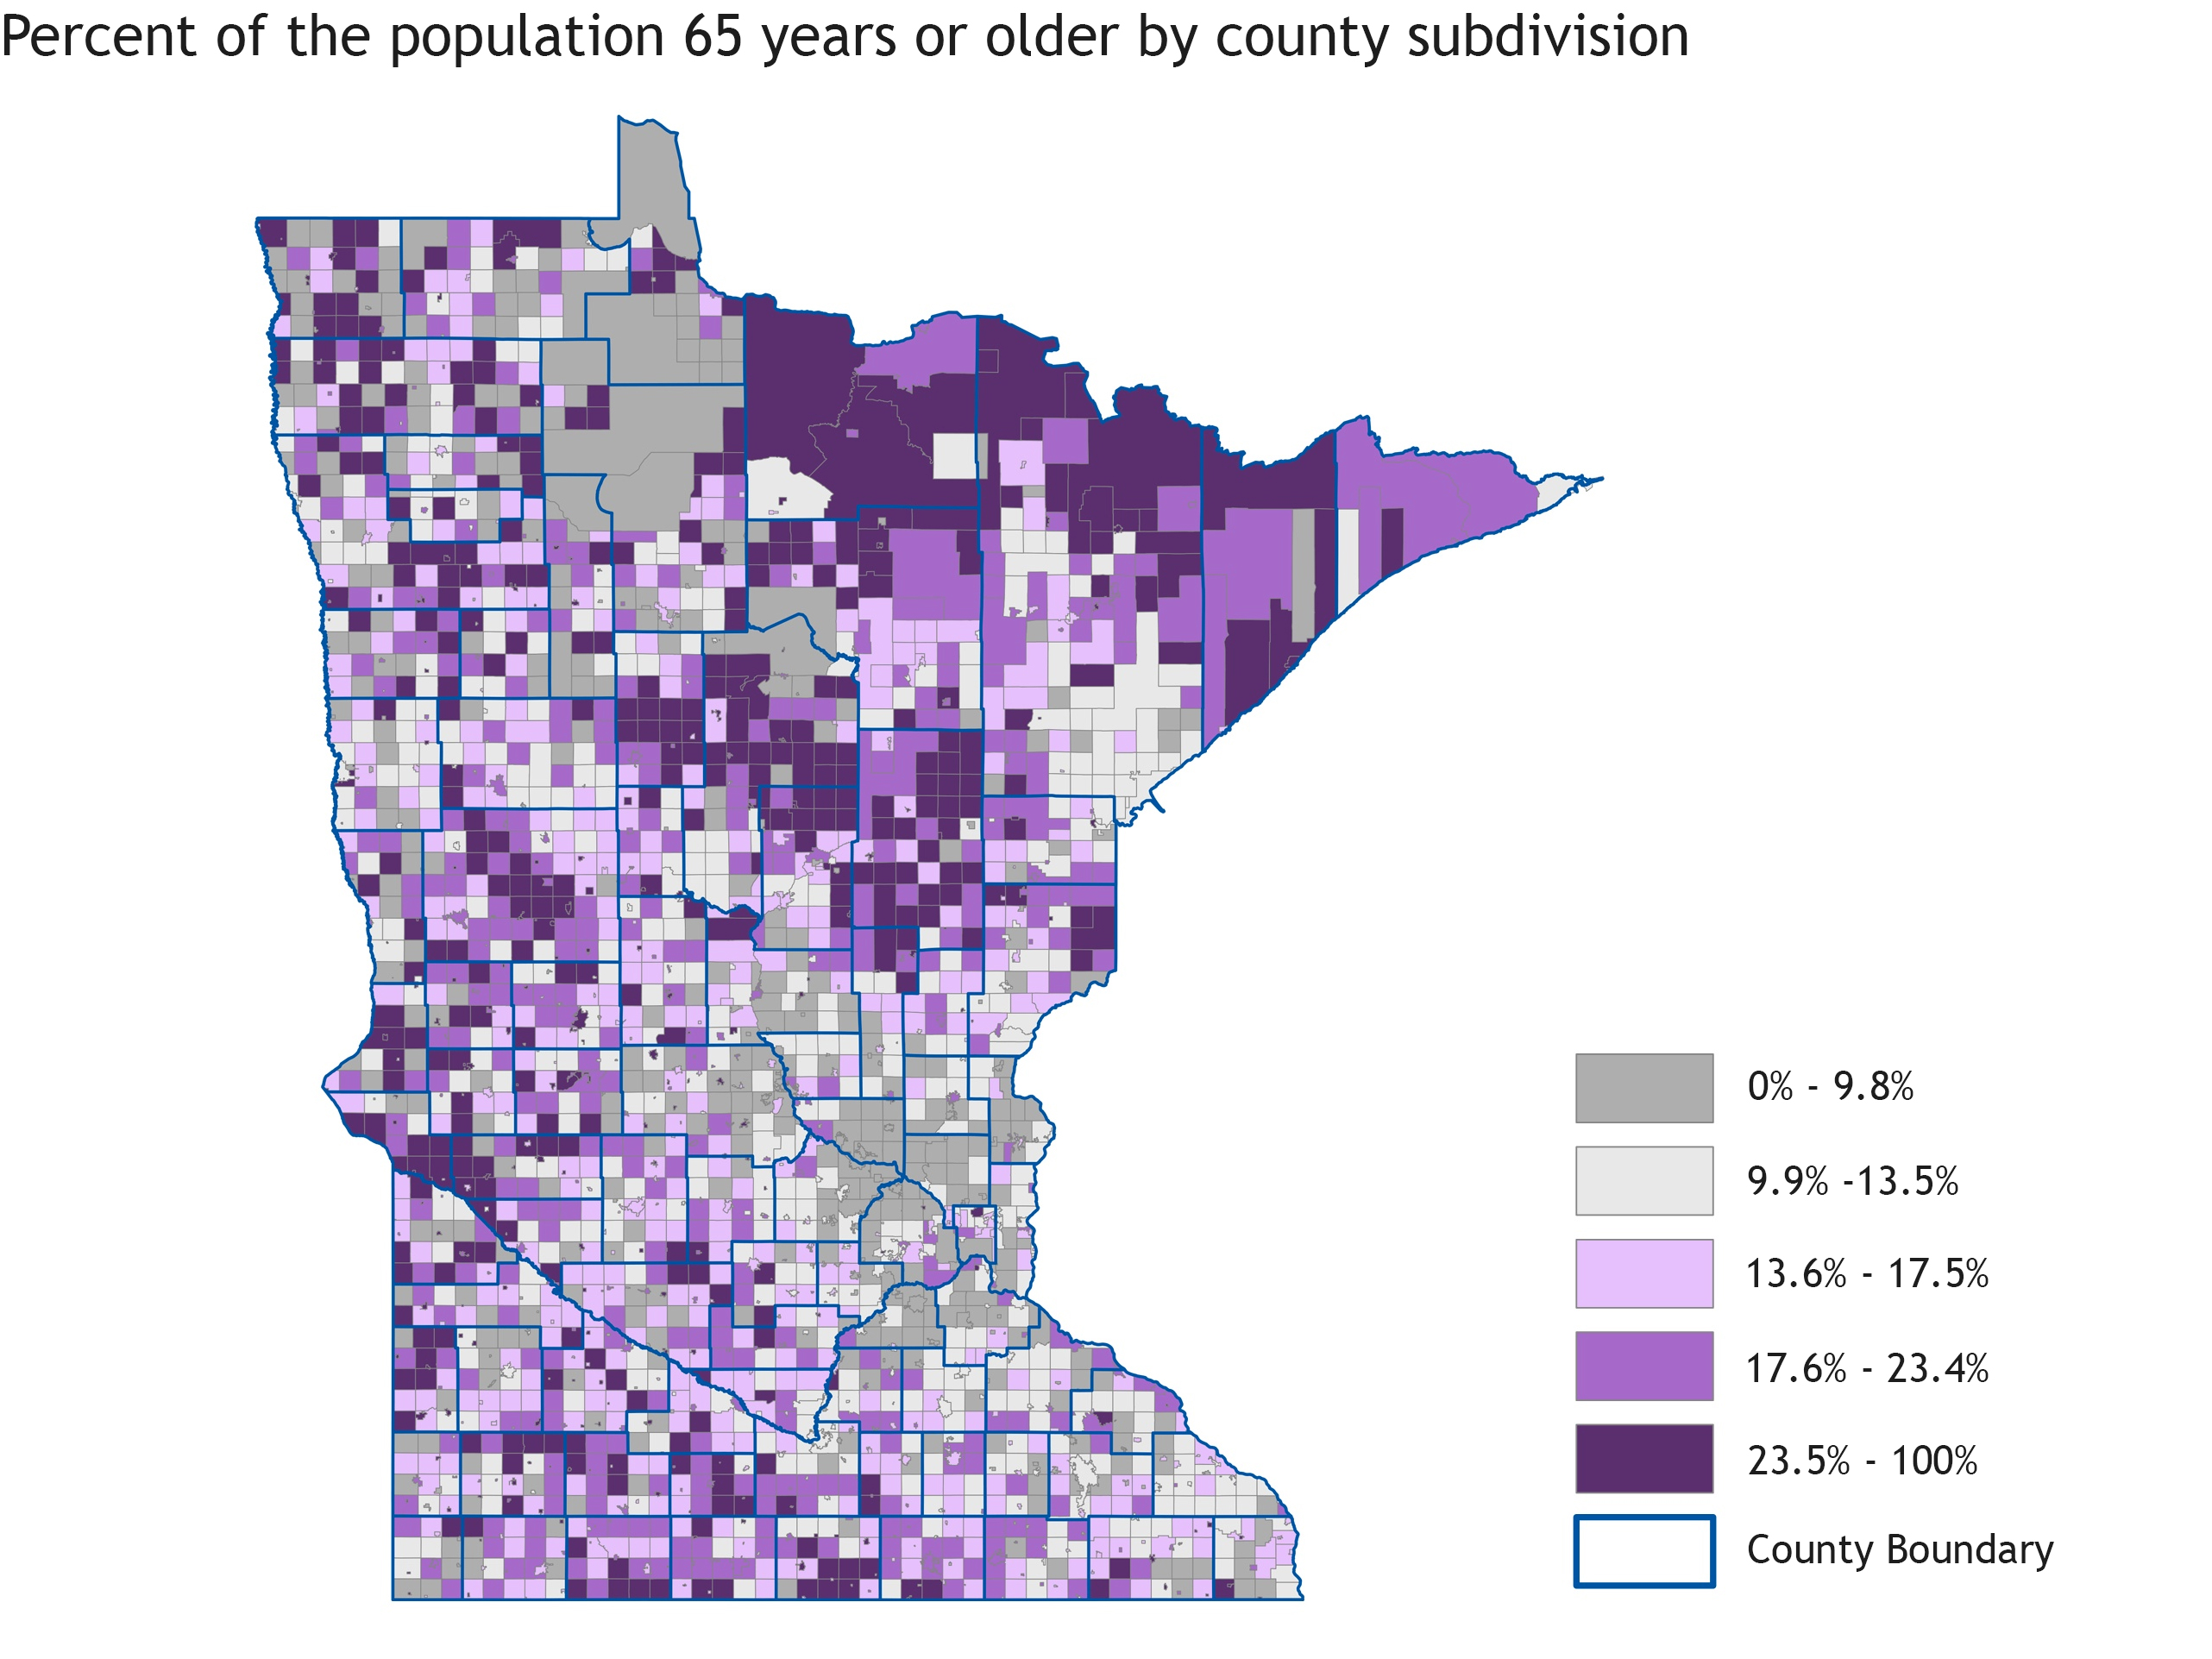
This map shows the percentage of the population 65 years or older by county. The darker the color the higher the percentage. Courtesy the Minnesota Department of Health.
This map shows the percentage of the population 65 years or older by county. The darker the color the higher the percentage. Courtesy the Minnesota Department of Health.