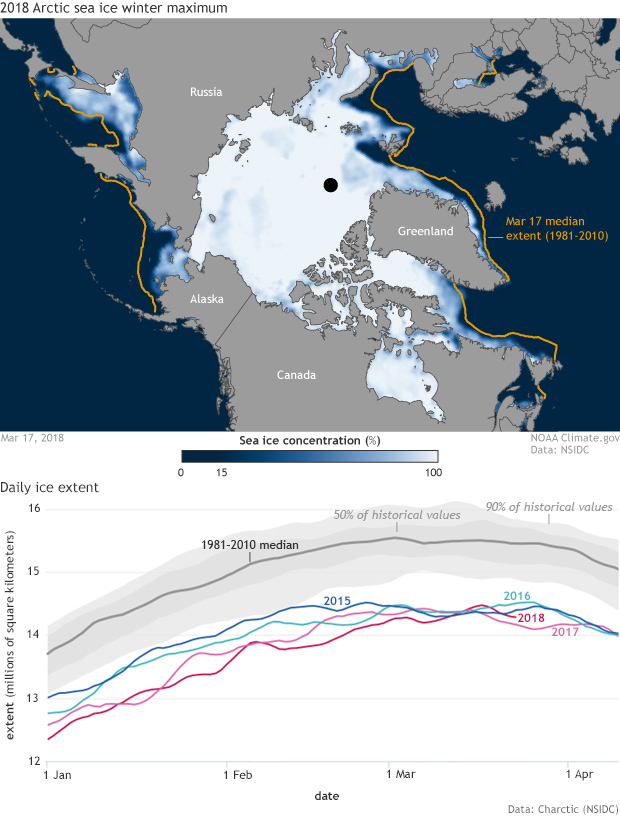
Image caption
(top) Arctic sea ice concentration on March 17, 2018, compared to the 1981-2010 median (gold line). The graph shows daily ice extent from January-April each year. Image by NOAA Climate.gov, based on data from the National Snow and Ice Data Center.