
Image caption
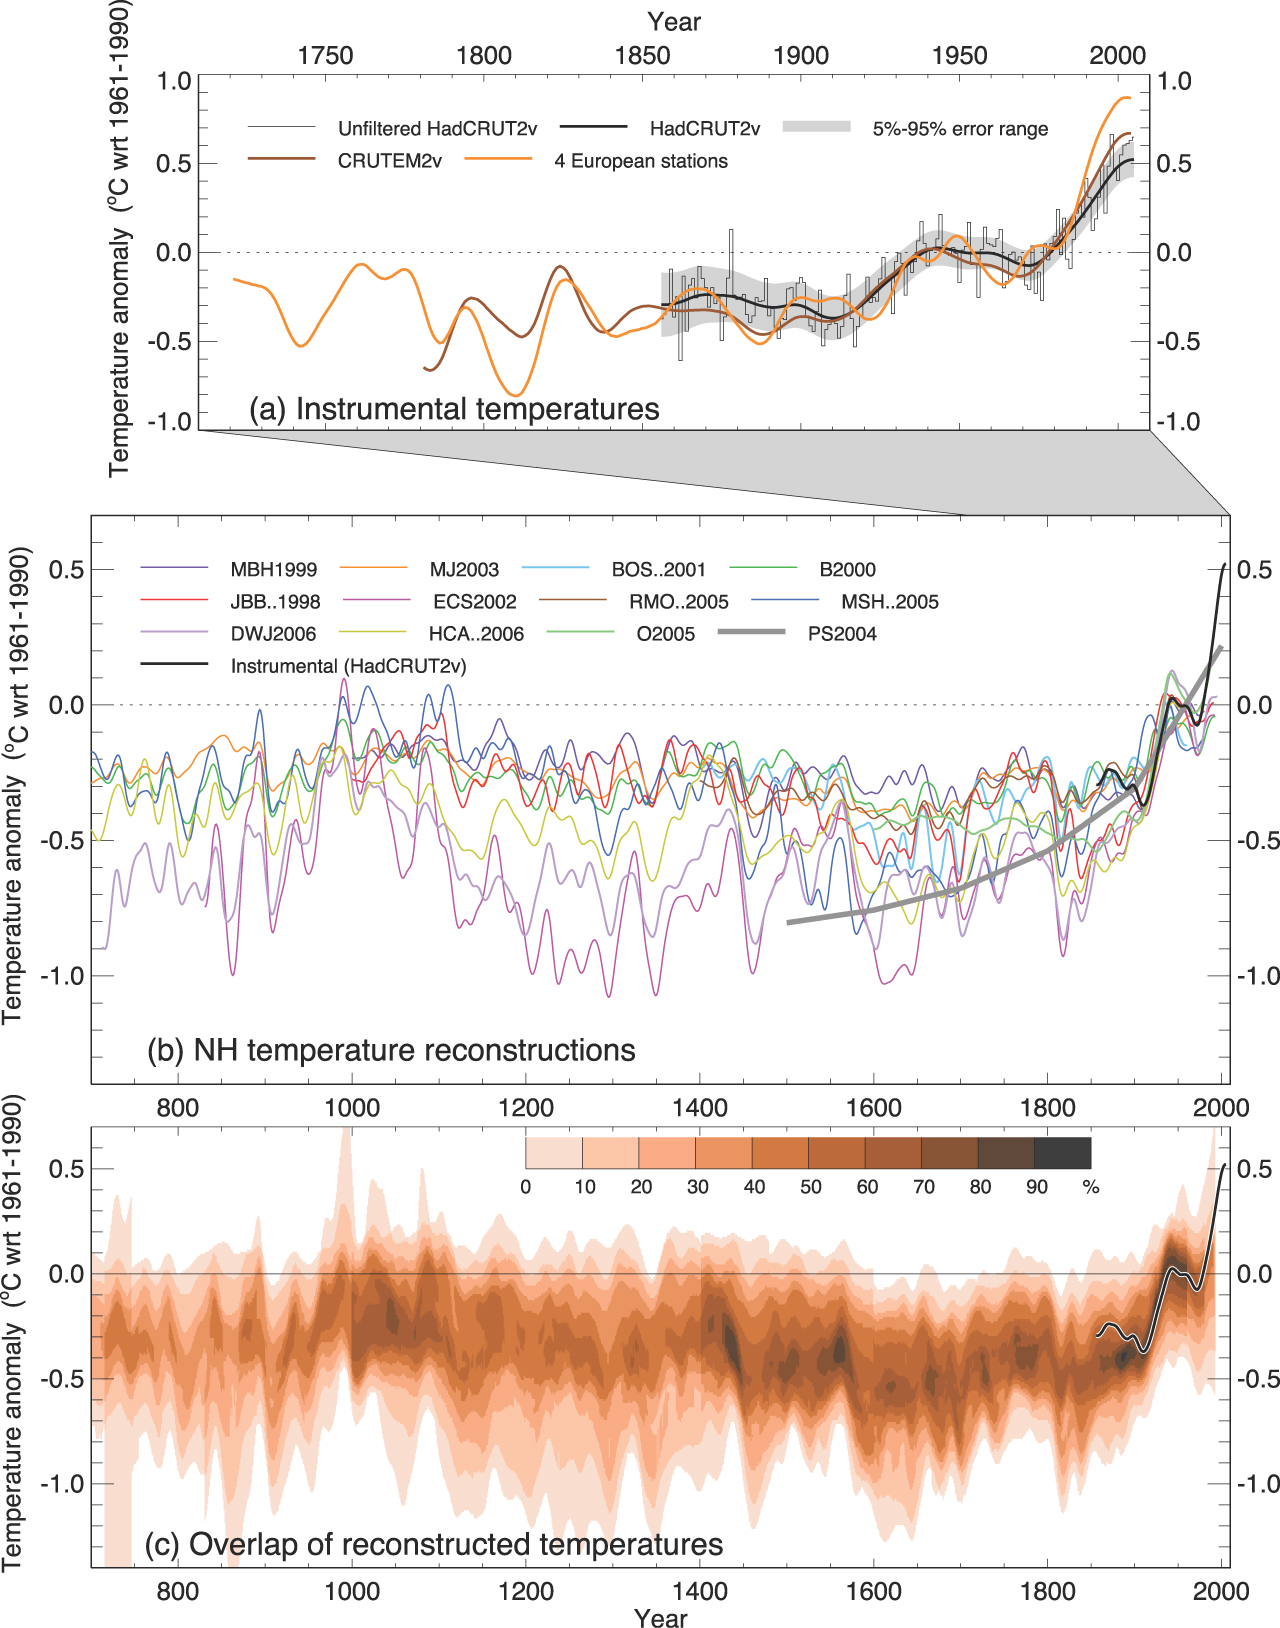
These three graphs show the general agreement of different types of proxy data. The climate history shown here is a reconstruction of temperature in the Northern Hemisphere. Image source: IPCC AR4 WG 1 figure 6.10.
These three graphs show the general agreement of different types of proxy data. The climate history shown here is a reconstruction of temperature in the Northern Hemisphere. Image source: IPCC AR4 WG 1 figure 6.10.