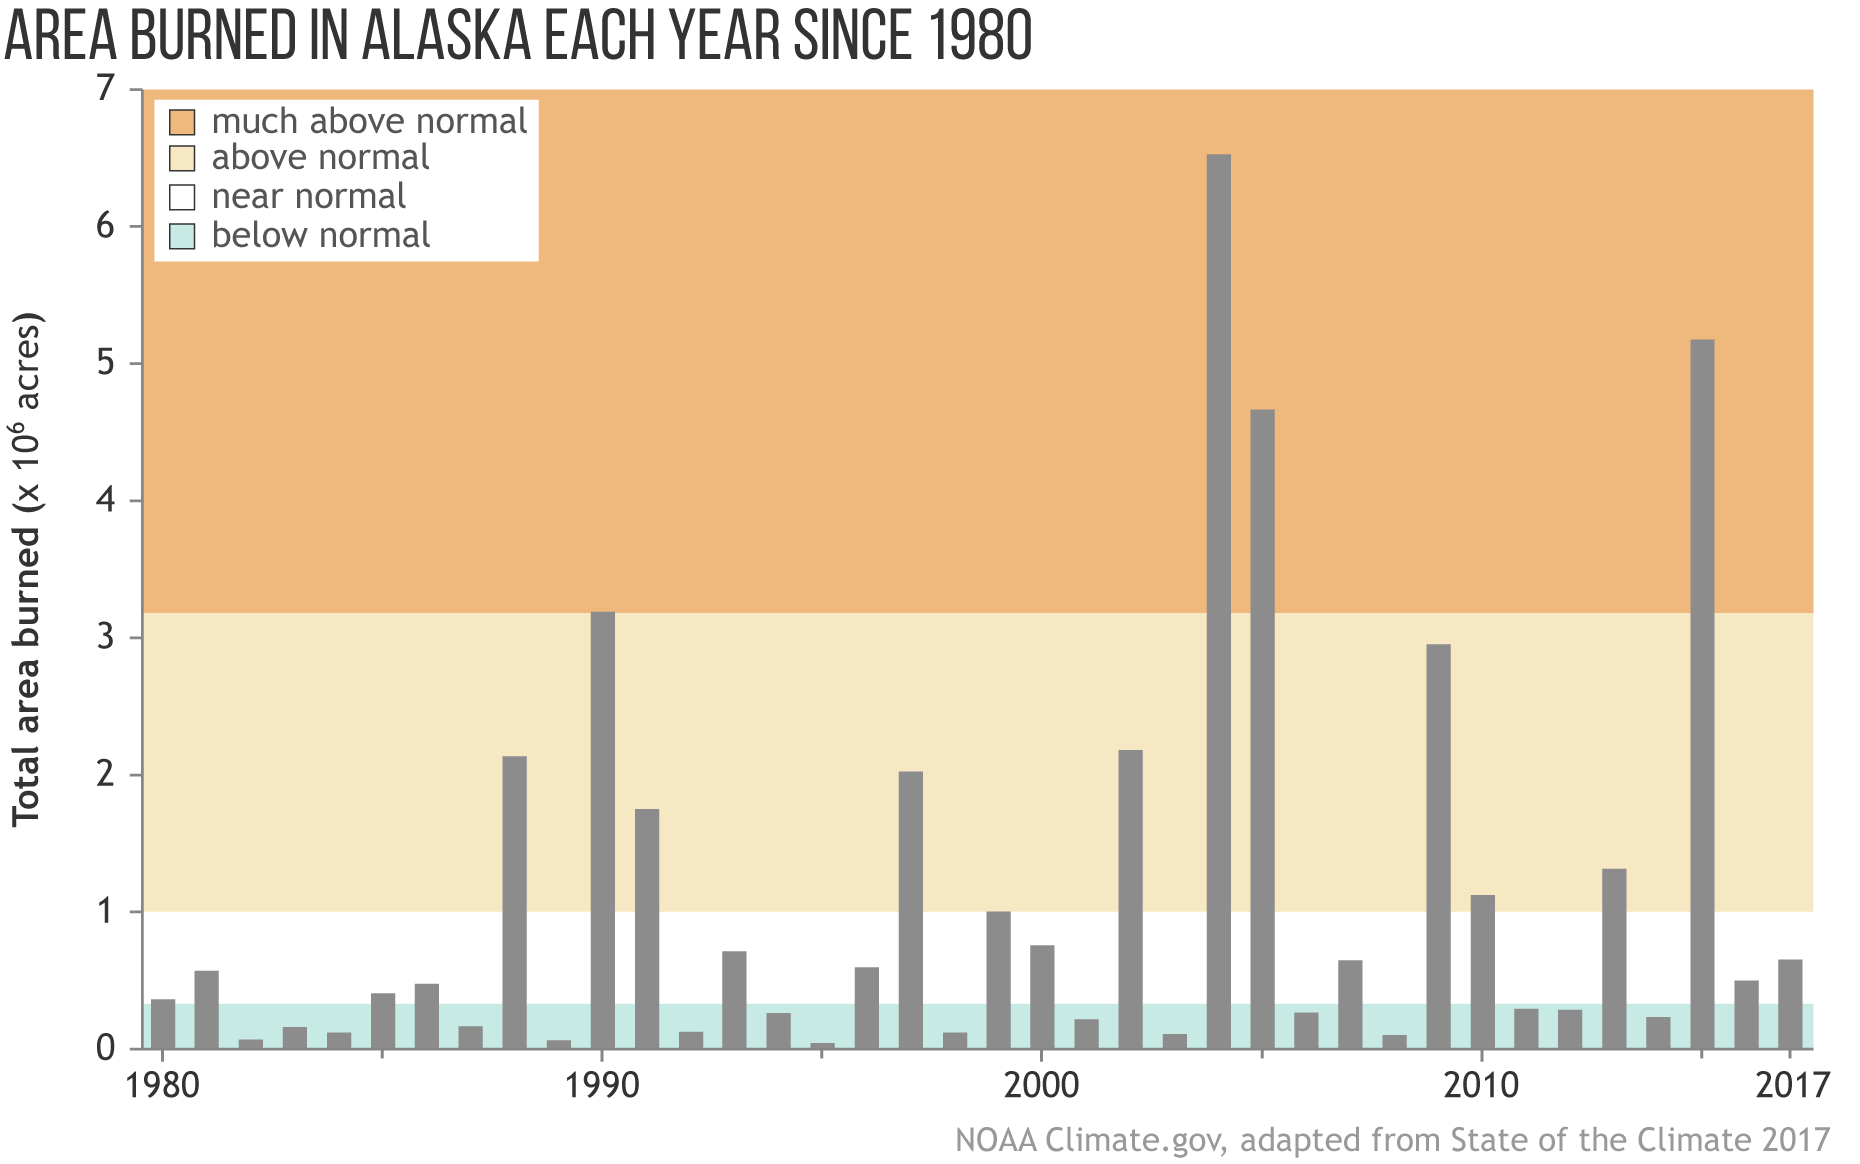
Image caption
Annual area burned in Alaska from 1980–2017. Burned area in 2017 was near the long-term average, but fires seasons are becoming more destructive over time. NOAA Climate.gov graphic adapted from Figure SB5.3 in State of the Climate in 2017.