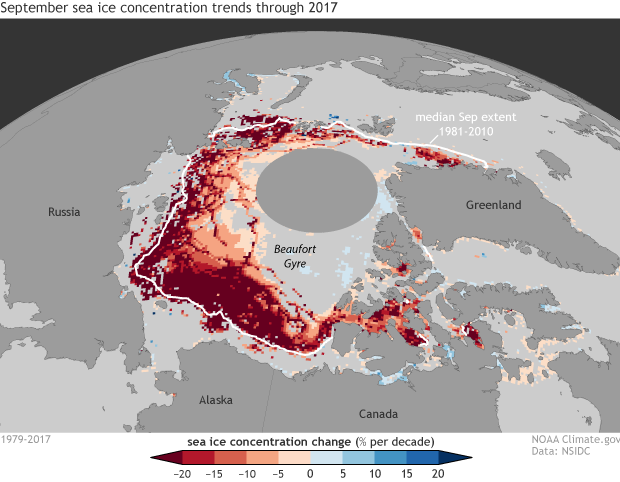
Image caption
This September 2017 Arctic Ocean map shows areas of increasing sea ice trends in blue, and areas of decreasing sea ice trends in red and orange.
This September 2017 Arctic Ocean map shows areas of increasing sea ice trends in blue, and areas of decreasing sea ice trends in red and orange.