Five Qs and As for August 2017
It’s been a tough few weeks weather and climate wise. Big events generate lots of questions, so this edition of Beyond the Data will address several I’ve heard recently, and several I asked myself.
Was Harvey’s rainfall really record-breaking?
It appears so, at least for the contiguous United States, from the perspective of “How much rain fell into a single official rain gauge over the course of a single tropical storm?” There is no official record for tropical cyclone, as far as the National Climate Extremes Committee has vetted, but the National Weather Service keeps an online resource listing peak rains for almost all named storms since 1950, and a few before that.
Comparing totals to that list, it appears that some of the totals from Harvey exceeded the listed totals for the contiguous U.S. (aka "CONUS"). Unless some other previously undiscovered data intervenes, it appears that Harvey will be the storm of record for the specific metric of “most rain into an official rain gauge."
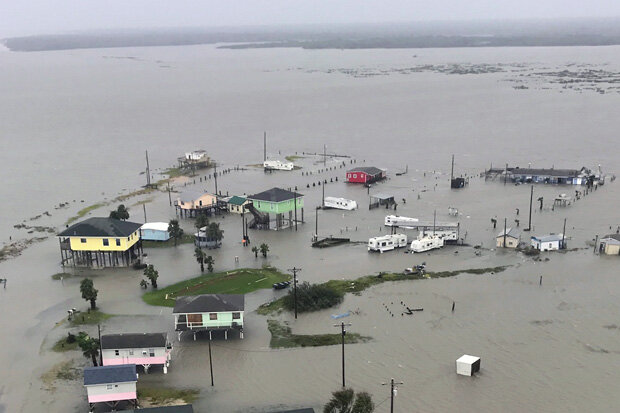
A flooded neighborhood on the Texas coast on August 27, 2017. Aerial photo by the Texas National Guard during aerial search and rescue mission in the Rockport, Holiday Beach, and Port Aransas area.
For a data blog, you haven’t published many Harvey-related numbers. Why not?
I’ve worked with extreme events long enough to know to wait. First off, that phrase “unless some other previously undiscovered data intervenes” isn’t as innocuous as it seems. It happens. Teams like the NCEC are deliberately deliberate in deliberating records. It’s not a trivial thing and takes time.
Secondly, there will continue to be data trickling in from Harvey itself. One of the many unfortunate consequences of destructive weather events is that some data have a hard a hard time making their way from observer to repository.
Thirdly, although I love this blog, this isn’t the place for records to live. In today’s information age, anything approaching some kind of vital record should live, and be discovered by search engines, in a purposely curated space.
Was Harvey the largest rainfall event of any type in the U.S.?
No. Looking strictly at the five-day rainfall totals (roughly the duration of Harvey’s rainfall for a given station in Texas),a handful of non-tropical cyclone events in Hawaii exceeded this amount. The largest of these occurred in March 1942, producing more than 70 inches at Honokane on the Big Island, and more than 50 inches at additional stations there, and on Maui and Oah’u.
Again, recognizing the sobriety of the realities we’re facing this month in multiple American coastal regions in the Gulf, Caribbean and Atlantic, one of the oddly rewarding aspects of working in an archive are the collisions between weather/climate and history.
Interestingly, the weather pattern that produced the huge rains repeated itself throughout the month and was a significant factor in thwarting a second (and much smaller) Japanese attempt to bomb Pearl Harbor. I won’t speak for fellow Beyond the Data author Jake Crouch, who shared it with me, but this was a new piece of history to me. Look it up: Operation K.
What other records did Harvey contribute to?
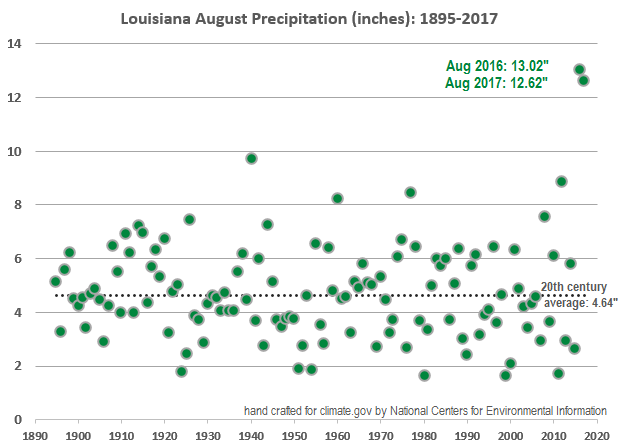
Texas had its wettest August on record, at 6.36” of rainfall averaged across the state. Louisiana’s 12.62” of precipitation statewide would have blown away the previous record by nearly three inches, had it not received 13.02” last August. The last two Augusts really, really stick out of the state’s climate record.

Each point on this graphic represents the rainfall, averaged across the state of Louisiana, for each August since 1895. The last two Augusts have been historical outliers.
Besides Harvey, what jumped out in August?
Both summer and August itself brought striking contrasts across the country, and even around the clock.
First off, the precipitation contrast between the Gulf Coast and the Northern Plains and Rockies this summer was stark. Much of the Gulf coast saw its wettest August on record, driven in part by Harvey, but genuinely wet even outside of it. On the flip side, much of the northern Plains and into the Northern Rockies saw its driest summer on record. Massive wildfires are burning there, even as Harvey soaked the Gulf Coast.
This paradoxical contrast - America is working on its wettest year on record while drought expands in the north - is one expectation in a warming world. More of our rains are coming in larger doses, leaving room for drydown in the interim. For the U.S., this is especially true generally east of the Rockies.
Considering temperature, the southern U.S., and Louisiana in particular, showed an extreme version of a pattern we’ve been tracking for much of the 21st century now - the downward trend (reduction) of the diurnal temperature range, a fancy way of saying the difference between morning and afternoon temperatures.
Louisiana’s average maximum temperature (the average “afternoon high”) for August 2017 was 88.6F. That may sound pretty warm if you’re from, say, Maine. But for Louisiana, that’s really on the cool side of history. The minimum temperature (“overnight low”) was 73.4F. That may sound insanely warm if you’re from, say, Maine. And Louisianans would agree.
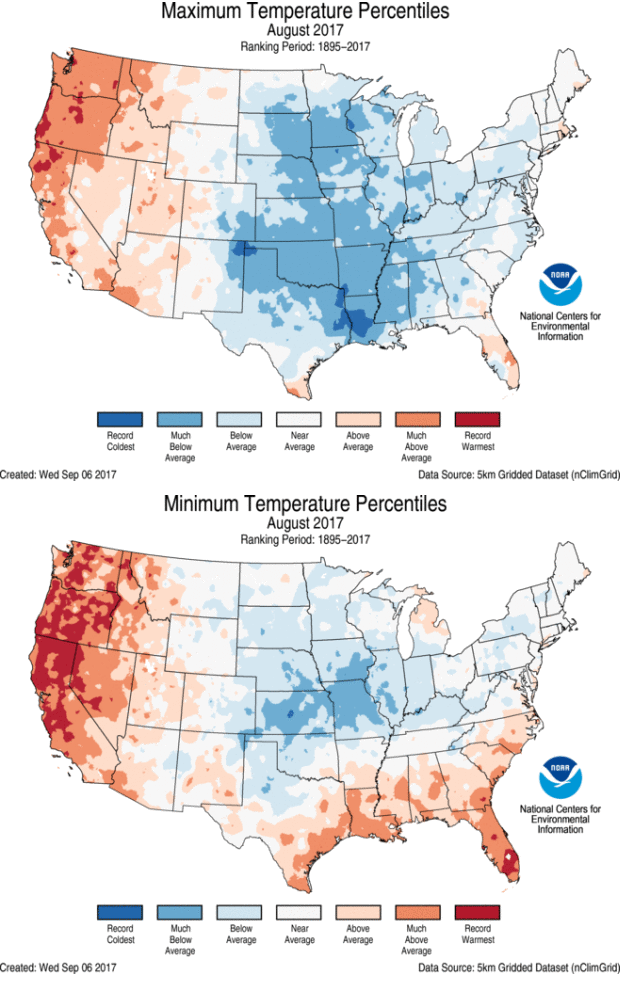
In fact, the afternoon temperatures were the second coolest for August in Louisiana’s 123-year record. The morning temperatures? Eighth warmest. I haven’t done the homework to back up any “most unusual ever,” claims, but I would be stunned if we’ve ever seen a discrepancy in ranks that large in the modern era.

This map shows the historical context for August 2017's temperatures across the country. The top panel is for maximum ("afternoon high") temperatures for the month. The bottom represents minimum ("overnight low") temperatures for the month. The categories for each are, from the outside in: Warmest/Coolest - the highest or lowest value of the 123 Augusts on record for that variable for that location; Much Warmer/Cooler - the top or bottom ten percent; Warmer/Cooler - the top or bottom one-third of history. Near Normal - the middle third of history. In much of the south, relative to history, afternoon temperatures were historically cool while morning temperatures were very warm.
If you’re wondering what would drive such an outcome: clouds and wet soils. Last week, Jake covered how wet soils can work to keep temperatures, especially afternoon temperatures, down. It turns out that, for August 2017, clouds were a big factor, too. Louisiana was decked in all month. It was a rainy month, even before Harvey. All else being equal, clouds tend to restrict cooling at night, and prevent rapid heating in the afternoons.
Thanks for reading and please stay safe and heed your warnings and advisories from the National Weather Service.

Comments
Add new comment