From cfs to sandbags: a public-private partnership turns technical forecasts into neighborhood-scale flood advice
Repeated flooding
Flooding of the Red River of the North has repeatedly devastated homes and businesses in and around Moorhead, Minnesota, and Fargo, North Dakota. From 2009 to 2011 alone, three major floods caused more than $1 billion dollars in damage, impacting the lives and livelihoods of people across the region.
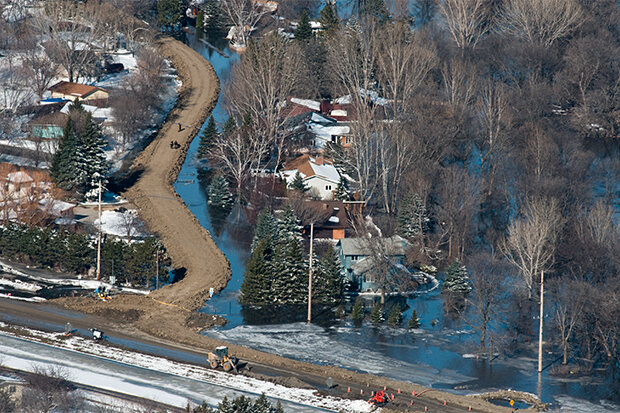
An area of Fargo, ND, is flooded by the Red River of the North in March 2009. Public Domain Photo Courtesy Patsy Lynch, FEMA.
As climate scientists project the frequency and intensity of flooding events to increase in many areas due to climate change, homeowners, businesses, and municipalities across the Red River Valley are eager for tools and information that can help them avoid damage and recover more quickly when flooding does occur.
Riverine flood forecasts from the National Weather Service’s North Central River Forecast Center (NCRFC) provide solid information for flood emergency planning efforts. For instance, emergency managers can view graphs showing estimated height and timing of high water at various points along a river. Though these officials understand how to convert cubic feet per second (cfs) of Tailwater, Pool, or In-flow Discharge on flood forecast graphs into maps showing areas that may be affected by flooding, the full range of folks who might be impacted by the event can't tell by looking at the graphs if they should expect flooding.
Collaborating to fight floods
In response to the high frequency of flooding impacts, leaders in the region created the Red River Basin Decision Information Network (RRBDIN).
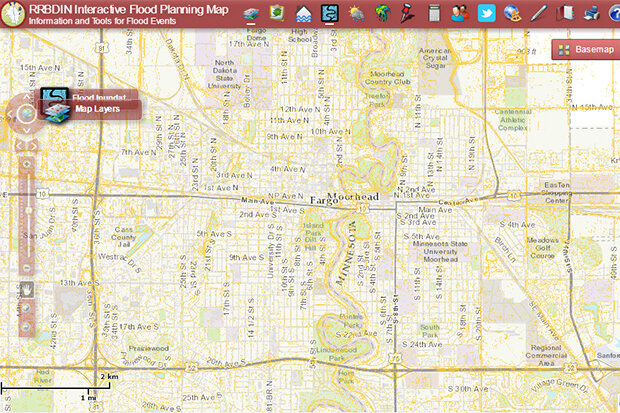
A screenshot of the RRBDIN’s Flood Forecast Display Tool.
This network facilitates collaboration among various entities, enabling them to develop and offer tools that can improve resiliency to flooding. One such collaboration is a public-private, nonprofit partnership among the North Central River Forecast Center (NCRFC), the International Water Institute, and Houston Engineering Inc. Members of this group gathered a range of specific data to help residents prepare for flooding, and then packaged it into a web-based visualization tool called the Flood Forecast Display Tool (FFDT).
Using the Flood Forecast Display Tool
In 2009, Dave DeMuth, a resident of Moorhead, Minnesota, consulted the FFDT’s interactive map to display visualizations of the flood forecast generated by the NCRFC. He examined an inundation map, an inundation depth grid, and graphics depicting the estimated arrival time of the flood’s peak as well as flow conditions in and around the region for the flood forecast period. Using information from the tool, he was able to estimate peak crest height, timing, and the sandbag count needed to protect resources in advance of the flood.
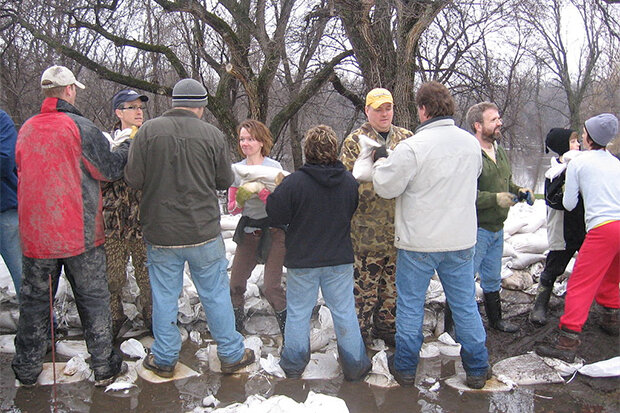
A line of volunteers moves sandbags to construct a dike in Fargo, ND, in March 2009. Photo Courtesy Adam Quartarolo, used via CC license.
Armed with this information, DeMuth interacted with homeowners who were forecast to be impacted and discussed strategies for fighting the flood. The FFDT helped him estimate the amount of time, number of people, and funds it would take to fill the number of sandbags needed to protect various assets. This vital information helped many residents protect their homes and businesses in 2009 and again in 2010.
Private residents, emergency responders, agricultural producers, and small businesses can also use the FFDT to get a sense of how they may be impacted before flooding occurs. For example, agricultural producers in the Red River Valley can access the tool during spring runoff events to visualize if and when their lands are likely to be inundated by floodwaters. This information empowers them to choose and implement adaptive strategies that increase the resiliency of their operations. Private residents can search for their address and access visualizations that show the extent of inundation expected in their neighborhoods. They can also use the Sandbag Calculator to estimate the number of sandbags they will need to protect homes and businesses.
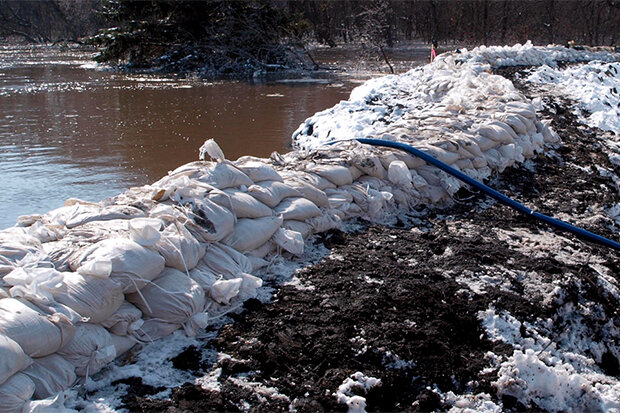
Sandbags block off flooding. Photo courtesy Michael Rieger, FEMA Photo Library. Public domain, via Wikimedia Commons.
The FFDT continues to provide valuable information to people in the Red River Valley during flooding, and serves as a successful example of a public-private partnership that applies emerging web-based technologies to encourage resilient responses to flooding. Additionally, the partnership plans to continue improving the tool: by incorporating NCRFC ensemble stream forecasts, they plan to offer probabilities that an area will be inundated, similar to the format weather forecasters use when predicting chances for rain or snow.
This article was originally published as part of the U.S. Climate Resilience Toolkit's "Case Studies" section. As part of the toolkit, users can learn how integrating the concept of resilience into disaster planning can help communities prepare for a range of hazards.
Original story credit: This story was adapted from a piece written by Mark Deutschman from Houston Engineering Inc.