If carbon dioxide hits a new high every year, why isn’t every year hotter than the last?
Just like your car doesn’t reach top speed the instant you step on the gas, Earth’s temperature doesn’t react instantly to each year’s new record-high carbon dioxide levels. Thanks to the high heat capacity of water and the huge volume of the global oceans, Earth’s surface temperature resists rapid changes. Said another way, some of the excess heat that greenhouse gases force the Earth’s surface to absorb in any given year is hidden for a time by the ocean. This delayed reaction means rising greenhouse gas levels don’t immediately have their full impact on surface temperature. Still, when we step back and look at the big picture, it’s clear the two are tightly connected.
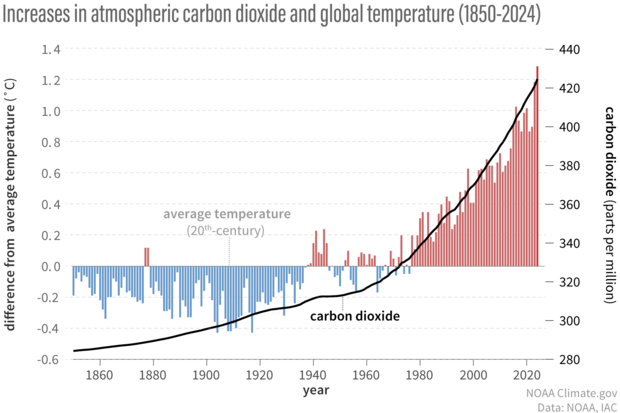
(bar chart) Yearly temperature compared to the twentieth-century average from 1850–2024. Red bars mean warmer-than-average years; blue bars mean colder-than-average years. (line graph) Atmospheric carbon dioxide amounts: 1850-1958 from IAC, 1959-2023 from NOAA Global Monitoring Lab. NOAA Climate.gov graph, adapted from original by Dr. Howard Diamond (NOAA ARL).
As the graph above shows, both global temperature (colored bars) and atmospheric carbon dioxide (black line) increased more slowly during the first half of the observational record in the late nineteenth and early twentieth centuries. Atmospheric carbon dioxide levels rose by around 20 parts per million over the 7 decades from 1880–1950, while the temperature increased by an average of 0.04° C per decade.
Over the next 7 decades, however, carbon dioxide climbed nearly 100 ppm—5 times as fast! To put those changes in some historical context, the amount of rise in carbon dioxide levels since the late 1950s would naturally, in the context of past ice ages, have taken somewhere in the range of 5,000 to 20,000 years; through deforestation and burning fossil fuels we’ve managed to do it in about 60. At the same time, the rate of warming averaged 0.14° C per decade. The rapid rate of temperature rise over such a short period time points to only one thing, and that is the addition of greenhouse gases, primarily carbon dioxide, into the environment.
Within any given decade, however, the temperature bounces around between warm and cool years. The warmest years are usually El Niño years, when the eastern and central tropical Pacific is warmer than average. The coldest years are generally La Niña years, when that same part of the tropical Pacific is cooler than average. On a longer time scale, warm decades are often associated with strongly positive phases of the Pacific Decadal Oscillation, and cool decades with strongly negative phases.
In general, the warmest year of any decade will be an El Niño year, the coldest a La Niña one. This graph shows annual average surface temperatures (gray bars), grouped by decade, from 1950 to 2021. The warmest and coldest years of each decade are topped with circles: red for El Niño-influenced years and blue for La Niña years. We considered a year El Niño or La Niña "influenced" if the December-February was labelled as part of a historical episode by NOAA's Climate Prediction Center or if more than half of the months in that year were. By our definition, 1979 did not qualify as El Niño year because El Niño conditions were present for only 3 months late in the year. 1992 was the coldest year of the 1990s despite being an El Niño year because of the cooling influence of the eruption of Mount Pinatubo in 1991. NOAA Climate.gov graph based on data from NOAA National Centers for Environmental Information.
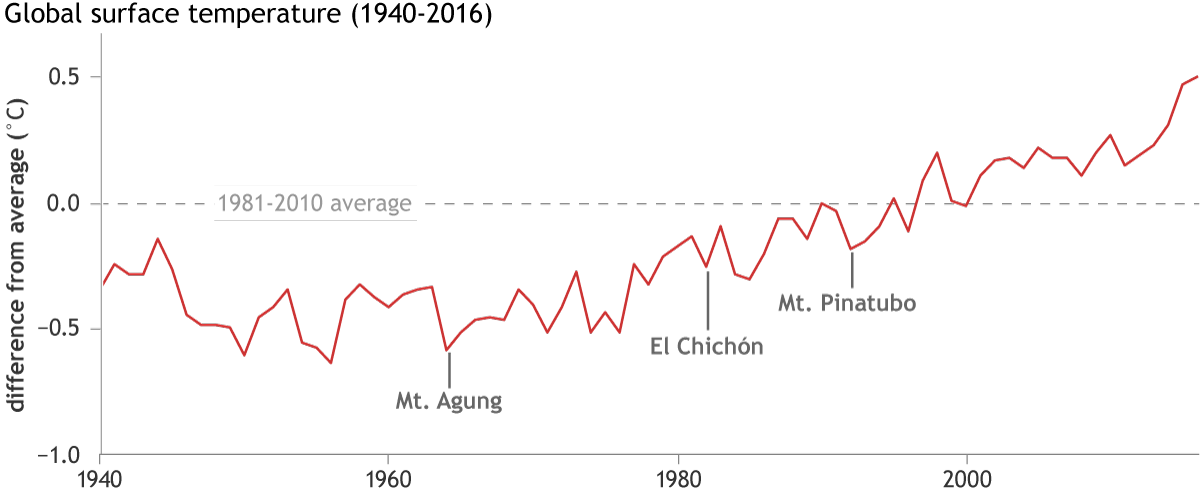
And while these natural climate patterns—through which the ocean alternately accumulates and releases heat—are the most important cause of short-term variations in global surface temperature, other factors occasionally contribute: volcanic eruptions, solar variability, and smoke and other pollution particles.
Pros and cons of thermal inertia
The global ocean buffers Earth’s temperature from rapid change; that stability has been fundamental to the evolution of complex life on our planet over millions of years. Even with respect to global warming, the ocean’s inertia works in our favor in one way: it provides us with a modest window of time to adapt to and begin to combat climate change before we are forced to confront its full effects on human health, coastal communities, and agriculture.

Like a room's worth of mess stuffed into an overflowing closet, excess heat from carbon dioxide is being hidden in the ocean—thanks to its tremendous heat capacity and volume. NOAA Climate.gov cartoon by Emily Greenhalgh.
But there’s a downside to the delayed reaction, too. Like a speeding train, surface warming might not stop the instant we hit the brakes because heat from deeper layers of the ocean will eventually resurface. Some of the earliest estimates from global climate models predicted that surface temperatures might continue to rise as much as 0.5 degrees Celsius over two to three decades after humans stopped adding greenhouse gases to the atmosphere. However, as models have become more sophisticated, some predictions of the amount of warming that we might expect following "net zero emissions" have gotten smaller, at least for warming amounts under 2 degrees Celsius.
A special report from the Intergovernmental Panel on Climate Change (IPCC) in 2018 concluded that if we reached net zero emissions in the near future, additional warming would be under 0.5 degrees C:
If all anthropogenic [human-caused] emissions...were reduced to zero immediately, any further warming beyond the 1°C already experienced would likely be less than 0.5°C over the next two to three decades (high confidence), and likely less than 0.5°C on a century time scale (medium confidence)…. A warming greater than 1.5°C is therefore not geophysically unavoidable: whether it will occur depends on future rates of emission reductions.
References
Allen, M.R., O.P. Dube, W. Solecki, F. Aragón-Durand, W. Cramer, S. Humphreys, M. Kainuma, J. Kala, N. Mahowald, Y. Mulugetta, R. Perez, M. Wairiu, and K. Zickfeld, 2018: Framing and Context. In: Global Warming of 1.5°C. An IPCC Special Report on the impacts of global warming of 1.5°C above pre-industrial levels and related global greenhouse gas emission pathways, in the context of strengthening the global response to the threat of climate change, sustainable development, and efforts to eradicate poverty [Masson-Delmotte, V., P. Zhai, H.-O. Pörtner, D. Roberts, J. Skea, P.R. Shukla, A. Pirani, W. Moufouma-Okia, C. Péan, R. Pidcock, S. Connors, J.B.R. Matthews, Y. Chen, X. Zhou, M.I. Gomis, E. Lonnoy, T. Maycock, M. Tignor, and T. Waterfield (eds.)]. In Press.
Cheng, L., K. Trenberth, J. Fasullo, T. Boyer, J. Abraham, and J. Zhu, 2017: Improved estimates of ocean heat content from 1960-2015. Sci. Adv. 3, 3, e1601545, Doi:10.1126/sciadv.1601545. http://advances.sciencemag.org/content/3/3/e1601545
Lindsey, Rebecca. (2018, Sep 4). Did global warming stop in 1998? NOAA Climate.gov. Accessed September 5, 2019 [https://www.climate.gov/news-features/climate-qa/did-global-warming-stop-1998].
MacDougall, A. H., Frölicher, T. L., Jones, C. D., Rogelj, J., Matthews, H. D., Zickfeld, K., Arora, V. K., Barrett, N. J., Brovkin, V., Burger, F. A., Eby, M., Eliseev, A. V., Hajima, T., Holden, P. B., Jeltsch-Thömmes, A., Koven, C., Mengis, N., Menviel, L., Michou, M., … Ziehn, T. (2020). Is there warming in the pipeline? A multi-model analysis of the Zero Emissions Commitment from CO2. Biogeosciences, 17(11), 2987–3016. https://doi.org/10.5194/bg-17-2987-2020