Meet 5 NOAA buoys that help scientists understand our weather, climate, and ocean health
Keeping track of ocean health is critical for understanding climate change, weather patterns, and the health of important fisheries. But how do NOAA and partner scientists gather data on such a vast environment?
One big way is with buoys, ocean observing platforms that help scientists monitor the global ocean — including in remote, hard-to-reach areas. Some of these buoys float along the ocean surface, gathering data as they drift with currents (sometimes even into the paths of hurricanes!). Some, meanwhile, are moored to the ocean floor, collecting data in the same region and helping scientists observe changes over several years or decades. In honor of Ocean Month, we’re highlighting five buoys that help NOAA scientists monitor and understand the ocean (and the Great Lakes, too!).
#1: Monitoring the Bering Sea with Peggy
NOAA’s biophysical mooring site 2—nicknamed “Peggy”—is one tough buoy. Since 1995, Peggy has been taking year-round measurements of temperature, salt content, nitrate, chlorophyll and currents in the remote Bering Sea. Data collected by Peggy has been used by scientists to study the cold pool and loss of sea ice in the Bering Sea, a region that supports large marine mammal and bird populations and some of the most profitable and sustainable commercial fisheries in the United States.
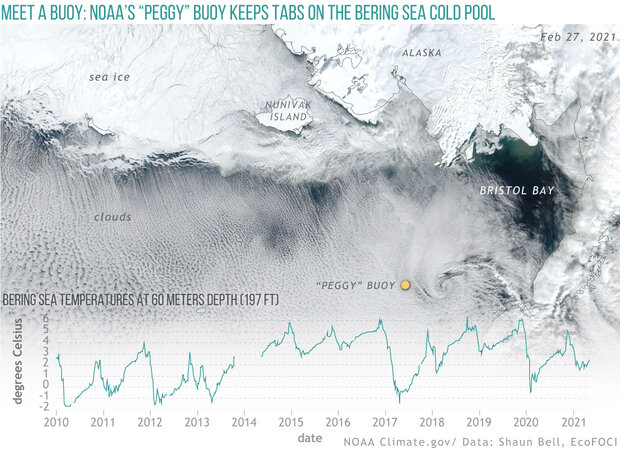
Many Bering Sea fish populations, including the commercially valuable Alaska pollock, thrive best when bottom waters remain cold throughout the summer. Located in the southeastern Bering Sea, NOAA's M2 moored buoy—nicknamed "Peggy"—records water temperatures and other physical and biological data from the surface to the floor of the coastal shelf, giving scientists an important glimpse into the status of the Bering Sea's summer cold pool. This graph shows Peggy's observations of water temperatures near the sea floor (depths of 60 meters, or 197 feet) from 2010 to mid-May 2021. In the early part of the 2010 decade, sub-zero winter temperatures and cooler summers were common. Recent years have been much warmer. NOAA Climate.gov image, based on NOAA buoy data from Shaun Bell. Background image from NOAA/NASA Suomi NPP satellite on February 27, 2021, via Worldview.
Peggy is named for Peggy Dyson, who for 25 years, from her home in Kodiak, Alaska, reported the weather, family messages, and sometimes even paid bills for the mariners of the North Pacific Ocean.
Peggy isn’t the only moored buoy gathering key ocean data in remote environments—learn more about Arctic moorings from NOAA’s Pacific Marine Environmental Lab.
#2: Keeping tabs on ocean acidification with the MAPCO2 buoy
The ocean absorbs about 30 percent of the carbon dioxide (CO2) that is released in the atmosphere, and as that CO2 is absorbed, it changes the pH of the ocean. Ocean acidification poses a big risk to marine life — as waters become more acidic, corals have a harder time building their skeletons, oysters and other shellfish have a harder time building their shells, and fish can experience worrisome behavioral changes.
A moored, autonomous buoy at Cheeca Rocks, in the Florida Keys, measures pH, dissolved carbon dioxide, and other water chemistry critical to coral reef health. NOAA image.
Moored Autonomous pCO2 (MAPCO2) buoys help scientists understand ocean acidification. There are currently 50 of these buoys worldwide, each of which is deployed either over a coral reef, in the open ocean, or in a coastal region. These buoys gather long-term data on carbon dioxide in the ocean, allowing scientists to track how ocean acidification is progressing in different regions.
One of these buoys is deployed at Cheeca Rocks, a coral reef within the Florida Keys National Marine Sanctuary off of Islamorada, Florida Scientists chose Cheeca Rocks because of its important coral habitat, which has managed to stay relatively healthy compared to reefs farther offshore. Scientists have been studying why these inshore patch reefs like Cheeca Rocks have been more resilient to environmental stressors, including coral disease, coral bleaching, and overfishing — and the MAPCO2 buoy helps in that effort. This buoy measures the partial pressure of CO2 (pCO2) in seawater, temperature, salinity, and pH every three hours. The data is open and available to the public.
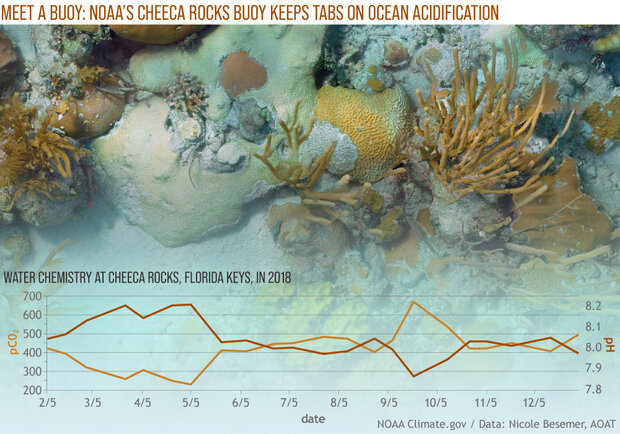
In the Cheeca Rocks area of the Florida Keys, NOAA has deployed a buoy to keep tabs on water chemistry. Among other things, the buoy records the amount of carbon dioxide dissolved in the water (pCO2, light brown line) and the pH (dark brown line), which indicates the seawater's acidity. Some of the reefs at Cheeca Rocks seem more resilient to heat stress and ocean acidification than others, and NOAA hopes that detailed observations coupled with high-resolution images (such as the one in the background) will help them understand why. NOAA Climate.gov image, based on MAPCO2 data provided by Nicole Besemer.
#3: Understanding the Great Lakes with the ReCON buoy
Buoys aren’t just for the ocean! NOAA Great Lakes Environmental Laboratory (GLERL) deploys buoys on the Great Lakes every spring. These 16 Real-Time Coastal Observation Network (ReCON) buoys gather a range of atmospheric and water data in the Great Lakes, including wave height, dissolved oxygen, chlorophyll, and water temperature. Data collected by ReCON buoys can help water managers keep tabs on water safety, warning of potential hypoxic (low-oxygen) events, which can affect drinking water quality. The short-term weather and water data ReCON buoys gather can help the public decide whether to hit the water for a day of boating or fishing, and the long-term data helps resource managers, educators, and researchers better understand Great Lakes health. If you’re planning a day out on the Great Lakes, you can even text a buoy to get information on current wind speeds, water temperature, air temperature and more. Explore Great Lakes buoy data via the NOAA National Centers for Environmental Information data repository.
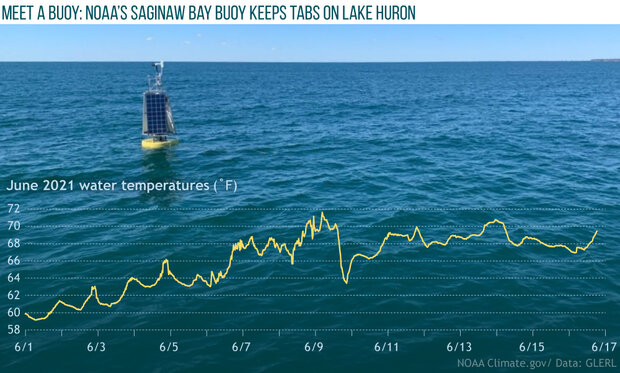
Part of NOAA's Real-time Coastal Observation Network, this buoy in Saginaw Bay records weather and water conditions in southwestern Lake Huron. The graph shows half-hourly surface water temperatures from June 1, 2021 through midday on June 16. NOAA Climate.gov image, based on images and data provided by NOAA's Great Lakes Environmental Research Laboratory.
ReCON buoys aren't the only ones that help scientists monitor water quality and predict harmful algal blooms on the Great Lakes. NOAA works with the Great Lakes Observing System (GLOS), and LimnoTech, a private engineering firm, to build monitoring capacity in central Lake Erie. One LimnoTech buoy, for instance, gathers data on oxygen levels near a water intake in Cleveland, data that’s then incorporated into NOAA models and allows scientists to alert water managers that this low-oxygen water -- which can be dangerous -- is too close to drinking water intakes.
#4: Understanding how the ocean affects monsoons with RAMA
Monsoons are seasonal shifts in wind that can cause heavy rain or droughts in regions from the tropics to the United States. A third of the world population depends on monsoon-driven rainfall for producing crops, so being able to understand and predict monsoons is critical to these populations — especially populations in India, which is primarily impacted by monsoons.
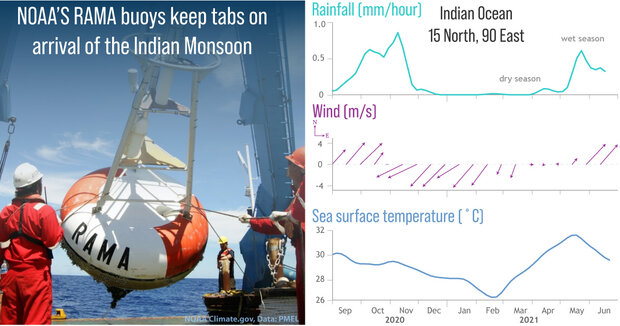
(left) A RAMA buoy being retrieved from the Indian Ocean. (right) Monthly rainfall (top), wind (middle), and sea surface temperature (bottom) from a RAMA buoy moored at 15 degrees North, 90 degrees East, in the Indian Ocean from late 2020 through mid-2021. These simultaneous observations of the upper ocean and the atmosphere allow us to better understand how they interact to produce the weather and climate, including the arrival and departure of the wet season of the Indian Monsoon, which provides the lion's share of water for crops in India and many other countries around the Indian Ocean rim. NOAA Climate.gov image, based on RAMA data from PMEL.
The Research Moored Array for African-Asian-Australian Monsoon Analysis and Prediction (RAMA) was designed to study the Indian Ocean’s role in monsoons and improve monsoon forecasts. RAMA is part of the Global Tropical Moored Buoy Array, which also includes buoy arrays in the Pacific (TAO) and Atlantic (PIRATA) Oceans. RAMA is the newest array of the three, initiated in 2004 to better study the traditionally data-sparse Indian Ocean.
RAMA has since grown through the formation of NOAA partnerships with Indonesia and India, and with contributions by Japan, China, and the Bay of Bengal Large Marine Ecosystem program. RAMA buoys collect data on a range of atmospheric and oceanic variables, including ocean temperature, salinity, currents, wind, sea level air pressure and humidity. In 2018 India's Ministry of Earth Sciences announced their Ocean Moored Buoy Network for the Northern Indian Ocean would provide open access data to the new Indian Ocean RAMA-OMNI moored buoy array - meaning even more ocean data is now shared freely among researchers, helping improve the accuracy of forecasts.
#5: Forecasting tsunamis with the DART Buoy
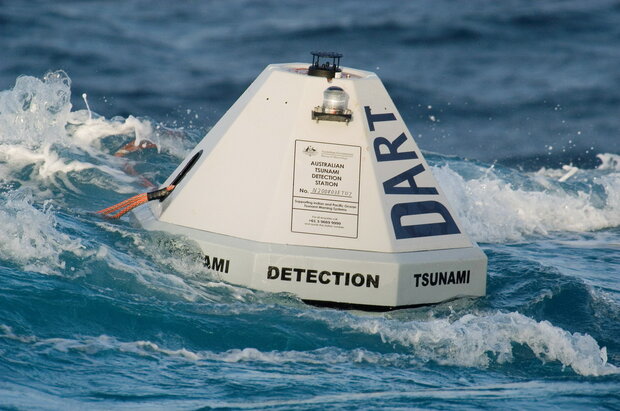
A DART—short for Deep-ocean Assessment and Reporting of Tsunamis—buoy floating on the ocean surface. The buoy is tethered to a pressure sensor on the ocean floor that detects passage of tsunamis. NOAA image.
DART buoys are critical tools in the effort to provide tsunami warnings to coastal communities. NOAA supports two centers — the National Tsunami Warning Center in Palmer, Alaska, and the Pacific Tsunami Warning Center in Honolulu, Hawaii—that provide forecasts and warnings of these large, dangerous waves.
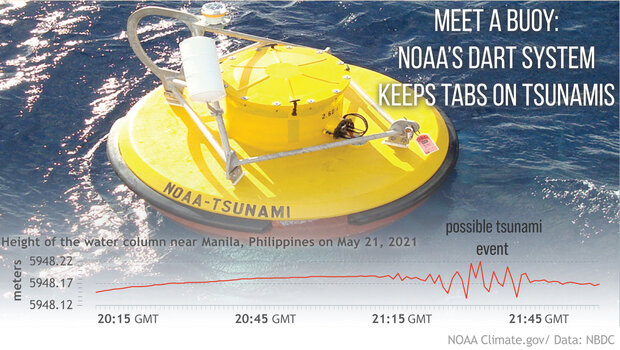
NOAA's DART buoy #52404 in the North Philippine Sea off Manila continuously monitors the height of the water column using a pressure sensor on the seafloor. In this graph of minute-by-minute data from May 21, 2021, the squiggles show rapid increases and decreases in the height of the water column—a sign of a possible seismic event that could trigger a tsunami. Not all earthquakes and water column disturbances produce tsunamis. Data from DART buoys is sent via satellite to experts who model the disturbance's likely impact on the ocean and decide whether a tsunami warning needs to be issued. Image by NOAA Climate.gov, based on photo and data from the National Buoy Data Center.
DART buoys are located strategically throughout the ocean — often close to locations where earthquakes that generate tsunamis are likely to happen - and gather key data on sea surface levels as a tsunami travels past them. After a tsunami is generated by an earthquake, a sensor located at the ocean floor communicates with the DART buoy on the surface, sending info about the magnitude of the tsunami wave directly to the Tsunami Warning Centers. The centers then create an estimate of where the tsunami was generated to produce a more accurate tsunami forecast and provide communities with the appropriate alert level (either a Watch, Advisory or Warning).
NOAA’s buoys are amazing tools — but they aren’t the only tools we use to monitor the ocean! Learn more about the drifters, buoys, gliders and floats that are key to ocean science from NOAA’s Global Ocean Monitoring and Observing Program.