A couple weeks ago, I wrote a post about the catastrophic flooding that inundated southeastern Louisiana after feet of rain fell in just a few days. More than 30 inches fell in some locations once the entire event was over. Thirty thousand people required evacuation, with at least 60,000 homes damaged, and twelve parishes declared federal disaster zones.

Flooding in southern Denham Springs, Louisiana, near the intersection of Interstate 12 and S. Range Avenue on August 15 (left), and three days later (right), after the waters had receded. NOAA aircraft images provided by the National Ocean Service.
I also talked about how heavy downpours along the Gulf Coast of the United States have increased since the middle of the last century. That trend is consistent with what climate experts have predicted would happen as greenhouse gases warmed the planet: more water vapor in the air to fuel extremely heavy rain.
By itself, that general connection isn’t conclusive evidence that global warming had a hand in the mid-August downpour in Louisiana. Now, however, a preliminary analysis of the event led by climate scientists at NOAA’s Geophysical Fluid Dynamics Laboratory found that warming due to greenhouse gases has made—conservatively—events like the one in August at least 40% more likely and 10% more intense.
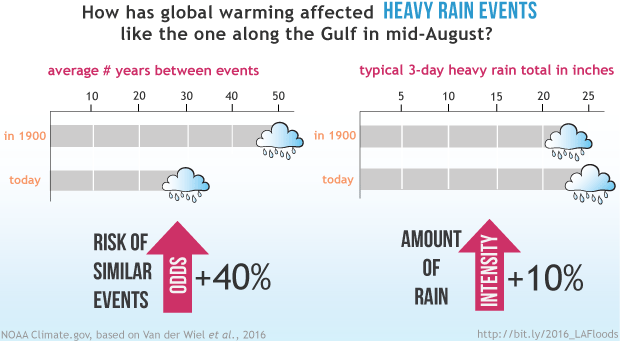
In mid-August 2016, a slow moving storm dumped more than two feet of rain in parts of southern Louisiana, forcing tens of thousands of people to evacuate and taking the lives of at least a dozen citizens. An attribution analysis found that the statistical return period for extreme rain events of that magnitude has dropped from an average of 50 years to 30 years due to global warming from greenhouse gases. And the amount of rain that would have fallen during a typical 30-year event in 1900 would have been 10% less than a similar event today, for example, 23 inches instead of 25. Graphic by NOAA Climate.gov, based on Van der Wiel, et al., 2016.
The analysis was conducted by scientists from NOAA’s Geophysical Fluid Dynamics Laboratory, Princeton University, the Royal Netherlands Meteorological institute, and Climate Central’s World Weather Attribution project. It was based on methods, observations, and models that have been widely used before in similar peer-reviewed studies, but this analysis has not yet been peer-reviewed. A copy has been published online by the open-access science journal Hydrology and Earth System Sciences Discussions, which has an open, online peer-review process. A final version of the paper will incorporate criticism and comments from others in the scientific community.
How did scientists figure this out?
Because the devastating flooding occurred due to the rainfall over the entire region, the scientists drew a geographical box around the part of the Gulf Coast impacted by the event, and studied the three-day rainfall totals in the region for the period from August 12-14. Over this region, observations indicate that rainfall amounts observed during the event usually happen somewhere in the region about once every 30 years. At any local site, the extreme rainfall totals were closer to 1-in-500 year events.
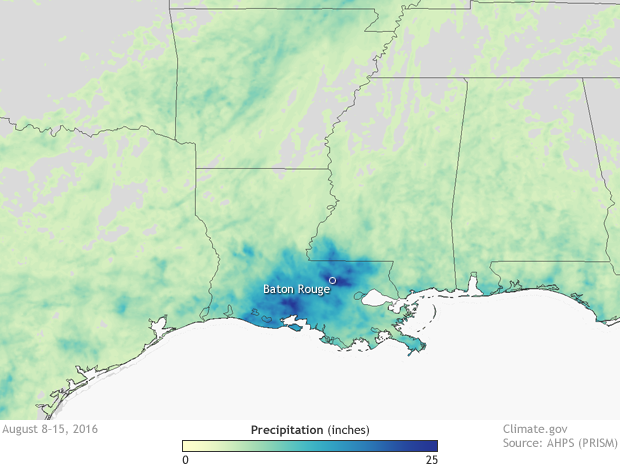
Precipitation totals (inches) from August 8-15, 2016. Over two feet of rain was observed in parts of southeastern Louisiana which led to catastrophic flooding, especially in areas around Baton Rouge. NOAA Climate.gov map based on data from AHPS.
Scientists applied statistical techniques on the observational data to determine how the frequency of similarly strong events has changed from the pre-industrial past to the present. But analysis of observations can only be used to detect a change: it can’t explain what may have caused the change. For that, scientists turned to two high-resolution NOAA climate models.
Using the climate models, scientists could compare virtual worlds in which the main factors that influence climate—ozone, dust and soot pollution, variations in the Sun’s output—were identical except that in one world, greenhouse gases were allowed to increase as they have in the real world, and in the other world, greenhouse gases remained as they were in the pre-industrial past.
What did climate change do?
Regardless of the data and methods used, the results were similar between observations and climate models: warming due to greenhouse gases has increased the chances for extremely heavy three-day rains across the Gulf Coast. Observations suggest the risk may have increased by more than a factor of 6, but with a wide range of uncertainty due to the relatively short record.
The models offered a more conservative estimate: the odds of similar downpours in the central Gulf region have gone up by a factor of 1.4, an increase of 40%. That means that an event that today occurs on average once in 30 years would have only occurred every fifty years on average back in 1900.
The analysis also found that the amount of rain that falls in these 1-in-30-year events has increased in intensity by around 10% compared to a 1-in-30-year events that would have occurred closer to 1900.
Why do these kinds of analysis?
When events of this magnitude occur, the natural reaction is to wonder: Why did this happen? And how did this occur? There are some simple answers. The event happened because a slow-moving storm system was able to wring out an incredibly moist air mass onto a particular area around Baton Rouge, Louisiana. The surrounding warmer-than-average Gulf of Mexico likely helped to provide some extra fuel, in the form of water vapor, for the epic rainfall totals.
But it’s also natural to wonder what role, if any, did climate change play in making this event so historic? It’s a much harder question to answer, but answering it may have scientific and practical payoffs. Results can help communities understand their current and future vulnerability to extreme weather and climate, which could help them make decisions about how to improve their resilience.
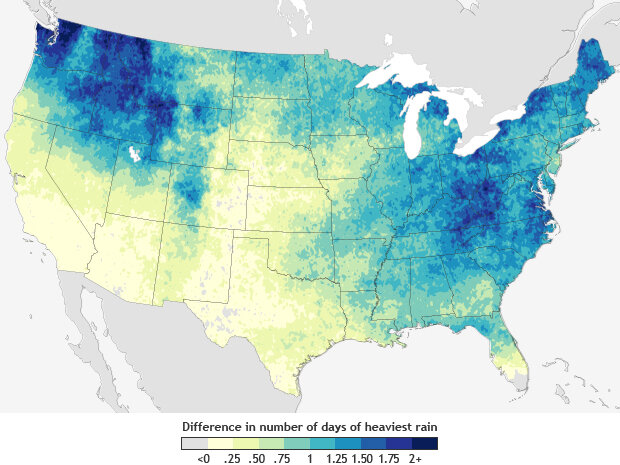
Predicted changes in the annual number of days of extreme rainfall across the United States by 2041-2070 as compared to 1971-2000 if greenhouse gases continue to increase at a high rate. By mid-century, some places could experience two or more additional days per year on which the rainfall totals exceed the heaviest rains historically experienced in the area. Maps by NOAA Climate.gov, based on downscaled CMIP3 multi-model data provided by Katharine Hayhoe. Original story.
For scientists, it also provides an opportunity to test the ability of climate models to simulate real-world extreme weather and identify places where the models need improvement. The better able our models are to re-create realistic extreme weather events, the more we can trust them to provide helpful information on what the future may hold.
References
Van der Wiel, K., Kapnick, S., Jan van Oldenborgh, G., Whan, K., and Philip, S., Vecchi, G., Singh, R., Arrighi, J., and Cullen, H. (2016). Rapid attribution of the August 2016 floodinducing extreme precipitation in south Louisiana to climate change. Hydrol. Earth Syst. Sci. Discuss., doi:10.5194/hess-2016-448, 2016
Links
How high resolution models improve simulations of extreme precipitation events in the United States GFDL research summary
Animation of HI-FLOR model simulations of clouds and storms (mp4)