While the western United States has been dealing with a non-stop onslaught of heat, wildfires, and smoke, the eastern United States has seen its summer dominated by weather forecasts containing the phrase “a chance of showers.”
Difference from average (1981-2010) precipitation during May, June and July 2018 expressed as a percentage of average for each climate division in the United States. Brown colors reflect less than average precipitation while bluer colors reflect wetter than average conditions. While the western US observed generally below-average precipitation, the eastern US, especially the Mid-Atlantic observed wetter than average conditions. NOAA Climate.gov image using data from the National Centers for Environmental Information.
From May through July 2018, much of the East Coast, especially the Mid-Atlantic, has been observing rain up to 300% of normal. In May, areas from Pennsylvania down to Florida saw rains 100 to 200% of normal. By June and July, the epicenter for heaviest rains became focused over the Mid-Atlantic, as monthly rains near Washington, D.C. through central Pennsylvania easily eclipsed 200% of normal.
To put some actual rainfall numbers out there, from June 1 through August 13, Baltimore, Maryland, observed over 23 inches of rain, a total over 250% more than normal. Washington, D.C., meanwhile, saw rains over 180% of normal at the same time. The rains in Maryland have been so heavy that, statewide, the May-July period was the wettest in state history (124 years), with July becoming the second wettest July on record.
Pennsylvania joined in on the record breaking, too. The May-July period for the entire state was the third wettest on record, with July 2018 being the wettest July in the last 124 years. In Williamsport, PA, home to the ongoing Little League World Series, the rainfall tally from June 1 through August 13 was over 21 inches, around 11 inches more than normal. (I’m sure the kids will have no problem playing in any muddy conditions. Their washing machines might not be too happy about it, though.)
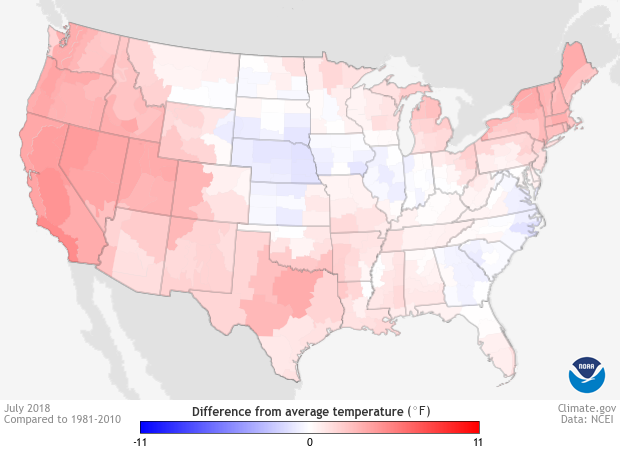
Difference from normal temperatures for the United States during July 2018. Blue colors reflect cooler than average temperatures while red colors reflect warmer than average temperatures. Much of the country was warmer than average during July 2018, even states where rainfall was excessive. NOAA Climate.gov image using data from the National Centers for Environmental Information.
Well, at least the temperatures were probably cooler than average then?
You’d think, at least. Normally if a three-month or one-month period is wetter than average, temperatures tend to be a bit cooler than average. Why? One simple reason is that more rain usually means more clouds, which keep daytime temperatures down.
But things didn’t exactly follow that pattern in 2018. May through July were near or record-warm for much of the country. And many states across the eastern United States observed average temperatures that were easily in the top 10 warmest since 1895. Even in July, when rains were incredibly heavy in the Mid-Atlantic, average temperatures were near to above-average. Pennsylvania, for instance, had its wettest July on record and its average temperature in July remained in the top 30 of all years back to 1895.
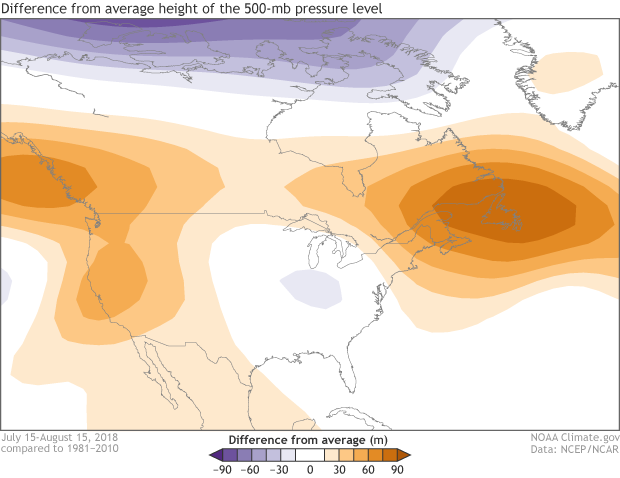
500-mb height anomalies over the United States for July 15-August 15, 2018. Positive height anomalies (oranges) correlate with dry conditions, while negative height anomalies (purples) correlate with wetter conditions. During the period, rainfall was well above-average over the eastern United States. NOAA Climate.gov map, based on NCEP/NCAR Reanalysis data.
What’s going on?
One incredibly stubborn and persistent weather pattern, that’s what. And it’s the same pattern that has led to the hot and dry conditions out west. Basically, the eastern United States has been stuck in a trough of low atmospheric pressure, or a place conducive for the development of rain storms, while to the west and northeast have been ridges of high atmosphere pressure. These high pressures have not only helped caused sunny skies and hotter temperatures, but they have also served as giant mountains in the atmospheric “landscape.” These atmospheric mountains have made it difficult for storms to move out quickly. And when weather lingers, extremes happen.
Climate Change
According to the 2014 National Climate assessment, average precipitation across the United States has increased. However, it is much more difficult to look at regional trends in seasonal precipitation for the future, especially for individual regions within the United States. That is not to say that scientists cannot say something about some regions in the United States. The northern United States (which includes many of the places mentioned above), for instance, is projected to experience more precipitation in the winter and spring due to both a warmer atmosphere holding more moisture and changes in the large-scale weather patterns. However, this increased-precipitation signal is not as clear for the summer time.
With that said, there is plenty of evidence that extreme rainfall amounts have already increased and will increase more in the future. The National Climate Assessment also notes that extreme downpours of rain are increasing most in the Northeast, a 71% increase from 1958 to 2012 of the amount of precipitation that falls during heavy events. And recent research, funded in part through NOAA’s Climate Program Office’s Modeling, Analysis, Predictions an Projections program, found that extreme rainfall accumulations (> 4.3 inches) from May-October have increased by a factor of 2-4 in the Northeast United States (Martinez-Villalobos, 2018). The damage that can be inflicted by such heavy precipitation events was dramatically shown earlier this May as torrential rains caused devastating flash flooding in Ellicott City, Maryland.
Because of this, NOAA continues to work to help communities not only identify their vulnerabilities to extreme rain events but to help them build resilience to them in a future heavily influenced by human-made climate change.
References
Martinez‐Villalobos, C., and J.D. Neelin. (2018), Shifts in Precipitation Accumulation Extremes during the Warm Season over the United States, Geophys. Res. Lett., 45. https://doi.org/10.1029/2018GL078465