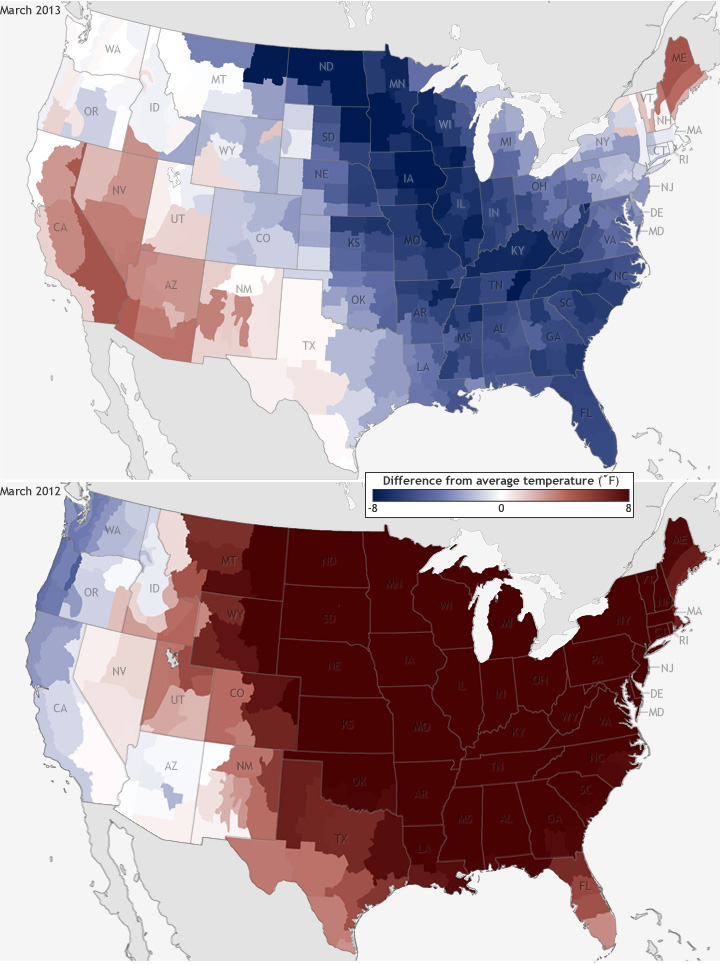
Looking at the temperature maps for March 2013, you might think that Old Man Winter over stayed his welcome or that Mother Nature was trying to make up for last March’s record-breaking heat. Much of the country felt spring would never arrive! All kidding aside, the maps above show the reality of the March 2013 temperature statistics, recently released by NOAA’s National Climatic Data Center.
These maps show where the March 2013 (top) and March 2012 (bottom) temperatures were different from the 1981–2010 average. The shades of red indicate temperatures up to 8° Fahrenheit warmer than average, and the shades of blue indicate temperatures up to 8° Fahrenheit cooler than average. The darker the color, the larger the difference from average.
As the March 2012 temperature map indicates, record- and near-record-breaking temperatures dominated the United States during the month. Every state in the nation experienced at least one record warm daily temperature during the month, and over 15,000 warm temperature records were broken. There were even several instances of the nighttime temperatures being as warm, or even warmer, than existing record daytime temperatures.
March 2013 was a stark contrast, as many of those same locations with record-breaking warmth in March 2012 saw temperatures below average during the month. The average temperature for the contiguous United States during March was 40.8° Fahrenheit, nearly 1° Fahrenheit below the twentieth-century average and the 43rd coolest March on record.
Most of the eastern United States was cooler than average during March 2013, with the exception of New England. Eleven states in the Ohio Valley, along the Gulf Coast, and in the Southeast had March temperatures that were among their ten coolest. In fact, Alabama, Florida, Georgia, North Carolina, and South Carolina had March 2013 temperatures that were even cooler than those of January 2013.
Despite the cool temperatures that covered most of country in March 2013, temperatures were above average for parts of the West. Arizona, California, and Nevada each had March temperatures ranking among their ten warmest. Above-average temperatures were also observed in Washington, Oregon, Idaho, Utah, and New Mexico. Overall, however, the nationwide picture couldn’t be more different than that of March 2012.
These climate statistics and many others are part of NOAA’s National Monthly Climate Report. The National Climatic Data Center produces these monthly climate reports as part of the suite of climate services that NOAA provides government, business, and community leaders so they can make informed decisions.
Caption by Susan Osborne and Jake Crouch, adapted from the January 2013 National Climate Report from the National Climatic Data Center (NCDC). Maps by NOAA Climate.gov team, based on U.S. Climate Division data from the NCDC. Reviewed by Jake Crouch, National Climatic Data Center.
