Interactive map: How has local sea level in the United States changed over time?
Global sea level has risen between 6 and 8 inches (15-20 cm) over the last 100 years. About one third of the increase is due to the thermal expansion of ocean water as it has gotten warmer, and about two-thirds is due to meltwater flowing back to the ocean as glaciers and ice sheets on land melt.
Global sea level rise is about what's happening to the ocean as a whole. At a local scale, the change can be more or less than the global average due to currents, natural climate variability, and things happening on land—like seismic activity, erosion, and subsidence. In some places, for example, coastal land is sinking due to groundwater pumping that causes the ground to slump.
The interactive map below (you can also launch the map in a new browser window) shows local sea level change as a linear long-term trend* at more than 100 of U.S. tide-monitoring stations in NOAA's Center for Operational Oceanographic Products and Service (CO-OPS) network. Blue, upward arrows show where local sea level is rising. Brown, downward arrows show where local sea level is falling. Darker colors mean bigger changes.
Click on an arrow to see a pop-up window that shows an animated gif of monthly sea levels each year throughout a station's period of operation. The color scale on the graphs shows older decades in dark purple and blue. More recent decades are lighter blue. In most places, local sea level is rising, but in a few places it's falling.
Line graphs of monthly sea level at the Fort Pulaski, GA, tidal station each year from 1935–2021, showing how they compare to the local mean sea level (1983–2001, dashed black line). Each year appears first as a black line, and changes to a permanent color as the animation plays. Darker-colored lines indicate earlier years; lighter-colored lines indicate more recent years. Click for a static image of the final frame. NOAA image by Julia Engdahl.
The rest of this article provides an overview of the main factors that influence regional and local sea levels around the coastlines of U.S. states and territories. These influences are broadly relevant to the region as a whole, but there could be additional factors that are uniquely relevant to specific stations that we don’t mention.
Regional patterns
The Gulf of Alaska
Every coastal location on Earth is being affected by global sea level rise. So why are there a lot of downward arrows around the Gulf of Alaska? Here, global sea level rise is being offset because the land is rebounding as the last remnants of ice-age glaciers disappear. Global sea level is rising, but the land is rising faster, so sea level is falling relative to a fixed local benchmark.
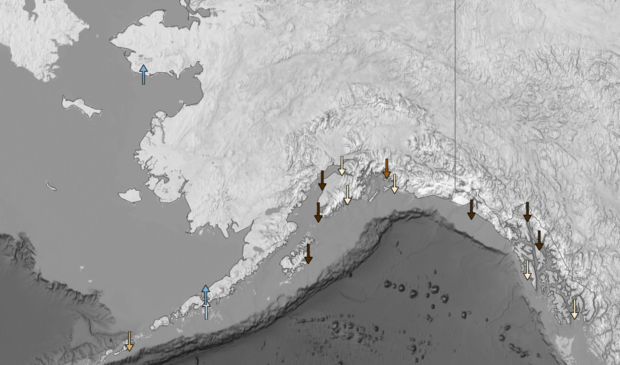
Local sea level around the Gulf of Alaska is falling, mostly because loss of glaciers is allowing the land to rise faster than global sea level is rising. Screenshot from Climate.gov/NOAA CO-COPS interactive map of local sea level trends.
Another factor that influences local sea level in this area is the tropical Pacific’s El Niño-La Niña climate cycle. On average, sea surface temperatures and heights in the tropical Pacific are higher in the west than the east. These differences are maintained by steady east-to-west winds–the trade winds.
During El Niño events, the trade winds relax. Very warm water that the winds normally keep “piled up” in the West Pacific around Indonesia sloshes slowly back toward the Americas. Upon reaching the western coast of South America, the bulge of warm water splits and heads northward and southward along the western coasts of the Americas, raising sea level all the way up to the Gulf of Alaska. During La Niña events, the trade winds strengthen, and the normal gradient–warm temperatures and higher sea level in the West, cooler temperatures and lower sea levels in the East–is intensified. Coastal sea levels are often lower than normal along the U.S. West Coast all the way to Alaska.
Over many decades, the sea level impacts of El Niño and La Niña tend to cancel each other out as far as the long-term trend is concerned. But the number of El Niños and La Niñas is not always perfectly matched over shorter time periods. During a decade with more El Niños than La Niñas, sea level around the Gulf of Alaska might be a little higher than what’s average for a given station. During a decade with more La Niñas than El Niños, sea level might be lower than average, other factors being equal.
The U.S West Coast
Like those in Alaska, the tide gauges on the West Coast show trends that are a combination of long-term, global sea level rise and, from one decade to another, El Niño and La Niña cycles. When El Niño is underway, surface waters in the central and eastern parts of the tropical Pacific are warmer than average over several months' time, and the warmer water brings higher-than-average sea levels. The region is colder than average during La Niña, and sea levels are lower than average.
The frequency of El Niño and La Niña events isn’t perfectly regular. Some decades have more of one phase than the other. (The frequency of events tends to be influenced by the Pacific Decadal Oscillation (PDO), which operates on about a 20-30 year cycle.) But over the span of many decades, El Niños and La Niñas more or less balance each other out, which means that they don’t push sea level in one direction or the other over the long term.
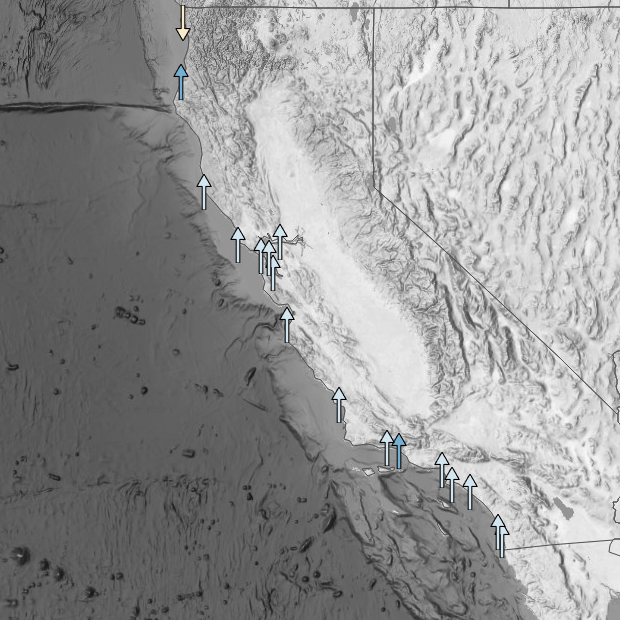
West Coast stations are generally experiencing rates of sea level rise that are close to the global average. Screenshot from Climate.gov/NOAA CO-OPS interactive map of local sea level rise.
Unlike Alaska, most of the West Coast was not covered by ice sheets. So glacial adjustment isn’t affecting these stations. As a result, many of them are experiencing local sea level rise that is close to the global average. This pace means that sea levels along the U.S. West Coast have been rising more slowly than those along the U.S. East Coast. This East Coast-West Coast difference in rates of relative sea level rise is projected to continue in coming decades.
The Pacific Islands
In the Pacific Islands, local sea level is affected by the global sea level rise trend, El Niño and La Niña, and one additional phenomenon: Rossby waves. Oceanic Rossby waves are very large waves–wide, not tall–that creep slowly from east to west in Earth's oceans basins. Rossby waves emerge in any rotating fluid, including both the ocean and the atmosphere (which behaves a lot like a fluid). In the ocean, Rossby waves can be triggered by changes in wind patterns or other atmospheric disturbances, such as those that occur during the breakdown of El Nino events.
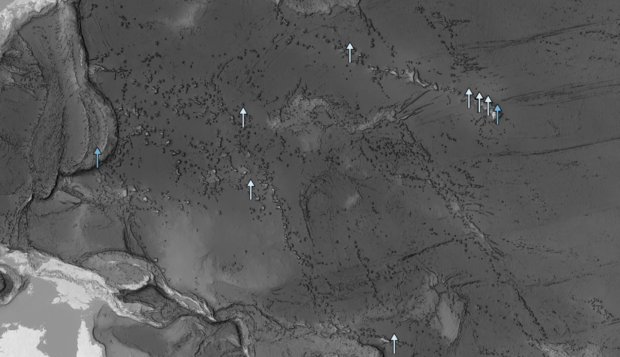
On a short-term basis, ocean patterns like El Niño and La Niña can add to or subtract from the global sea level rise trend at stations in the Pacific Ocean. Screenshot from Climate.gov/NOAA CO-OPS interactive map of local sea level rise.
The arrival of a Rossby wave in the Pacific Islands may raise local sea level by upwards of a half a foot or so, but it happens over many weeks–so gradually it would normally go unnoticed in the normal coming and going of the tides. When Rossby waves combine with global sea level rise, however, local sea levels may hit new highs, causing flooding that they wouldn’t have caused in the past.
Like El Niño and La Niña, Rossby waves are a kind of natural variability in Earth’s climate system, so they don’t create a long-term trend. Depending on their frequency in a given year or decade, however, they may influence local sea level over shorter periods of time.
Western Gulf of Mexico
In many parts of the Gulf of Mexico, local sea level is rising faster than the global average. Coastal land around the Western Gulf is sinking because people are pumping groundwater out of aquifers faster than natural processes can put it back. As the water disappears, soil compacts and the ground sinks and settles, so sea level rises relative to the original benchmark on land. A similar sinking effect occurs due to pumping oil and natural gas.
Another influence in this area is variations in the strength and location of the Loop Current. The Loop Current carries warm water from the Caribbean Sea northward in a clockwise loop around the Gulf of Mexico. It reaches farther north in the summer than it does in winter. In addition to this seasonal variability, sometimes the top of the current’s “loop” breaks off from the main current. When these eddies of warm water drift near the Gulf Coast, they raise local sea levels.
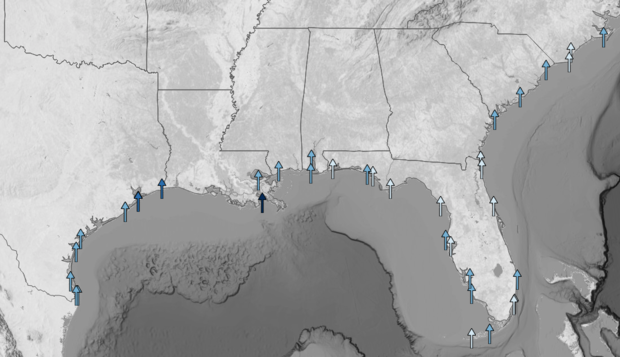
The pumping of groundwater, oil, and natural gas around the western Gulf of Mexico is causing the land to sink, adding to global sea level rise. In the central and eastern part of the Gulf, natural settling and compaction of sediment from the Mississippi and other rivers is causing the land to fall. Screenshot from Climate.gov/NOAA CO-OPS interactive map of local sea level rise.
Eastern Gulf of Mexico
Some of the fastest rates of sea level rise in the United States are occurring in the Eastern Gulf of Mexico. From the Mississippi Delta to Florida, sea level is influenced by the global trend, land subsidence due to excessive groundwater pumping, and variability in the Loop Current.
A final contributor to local sea level change in Eastern Gulf locations is sediment compaction in the large river deltas, especially the mouth of the Mississippi. Large river systems deposit tremendous amounts of sediment, creating new partially submerged lands and marshes. Over time, the sediment grains settle more tightly, squeezing out water. The ground sinks a little as the sediment becomes more tightly packed.
In a naturally flowing river, this soil compaction would be continually offset by new sediment. But human engineering of the Mississippi to control floods means that the outflow of the river is diverted offshore, creating a “bird foot” delta far offshore and preventing deposits of fresh sediment. Without fresh sediment to rebuild the compacted soil, the rates of subsidence are very high, which makes local sea level rise higher than the global average.
Southeast
The coastal land in the Southeast, including the Carolinas, Georgia and eastern Florida, is very low in elevation, which puts the region at high risk of being permanently submerged as sea level rises. Already, some communities in this region experience flooding of storm drains and other infrastructure during especially high tides, even without a storm.
Aside from global sea level rise, the other main influence on local sea level in this region is variability in the Gulf Stream. The Gulf Stream is a powerful, but fairly narrow ocean current that literally pulls the sea away from the shore a bit, lowering sea level. A northward flowing current in the northern hemisphere has to have a west-to-east increase in sea surface height to flow northwards. When the current slows, the sea level height gradient relaxes toward the coast, adding to local sea level.
Animation of sea surface currents in the Gulf of Mexico and off the U.S. Southeast coast from https://earth.nullschool.net/. The Gulf Stream Current pulls water away from the U.S. Southeast, producing a height gradient with lower sea level near the coast and higher sea level farther out. A slowdown in the Gulf Stream with additional global warming is projected to accelerate sea level rise in the Southeast and Mid-Atlantic.
In the short term, changes in the strength and location of the Gulf Stream—how near or far from shore it is—can cause variations in the height of seas on a seasonal or yearly basis. But ocean circulation models project that the Gulf Stream system will weaken as the climate warms. It is unclear from observations if this change is already happening, but all ocean climate models suggest this will happen in a warming world. A long-lived slow-down in the Gulf Stream is likely to accelerate sea level rise along much of the East Coast, including Florida.
Mid-Atlantic
For U.S. regions, the Mid-Atlantic has, by far, the most local influences on sea levels. As such, local rates of sea level rise across the region are consistently well above the global trend. On top of the global sea level rise trend, this part of the U.S. coast is affected by groundwater withdrawal, ocean variability related to the Gulf Stream and El Niño and La Niña, and impacts from the last ice age. However, the last two influences don’t act in exactly the same way as they do in other areas.
Unlike in the Pacific, sea level impacts in the Mid-Atlantic from El Niño and La Niña aren’t directly related to sea surface temperature and ocean circulation. Instead, impacts are related to “teleconnections” in the atmosphere; disruptions to the atmosphere over the tropical Pacific lead to a cascade of long-distance impacts on the rest of the global circulation of the atmosphere. These atmospheric disruptions have a cascading influence on the ocean.
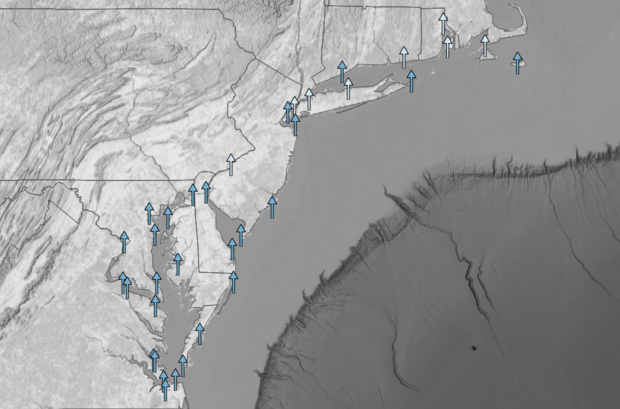
Local sea level in the Mid-Atlantic is rising more quickly than the global average thanks to post-ice-age adjustments on land and other factors. Screenshot from Climate.gov/NOAA CO-OPS interactive map of local sea level rise.
Among the disturbances are changes to the prevailing westerlies over eastern Canadian waters. El Niño leads to an increasing number of storms tracking off of the coast, causing higher-than-normal storm surge frequencies and slightly higher local sea levels overall. During La Niña, the jet stream’s strong westerly orientation weakens. The jet has many peaks and troughs, and it favors a path that tends to keep winter storms west of the Appalachian Mountains, so storm-related sea level increases are less frequent.
In contrast to much of Canada and its territorial waters, where ice-covered land is rebounding upwards from the previous ice age, the Mid-Atlantic is sinking in response to the last ice age. When the miles-thick Laurentide ice sheet covered the land to the north, its weight forced magma from the area under the ice sheet out to the edges, to the Mid-Atlantic area. The area was uplifted like the high end of a teeter-totter. With the ice sheets now gone, the Mid-Atlantic is sinking back to its natural level as the magma slowly adjusts to equilibrium.
This combination of influences makes rates of sea level rise along the Mid-Atlantic among the highest in the United States.
Northeast
Across the Northeast, local sea level trends are mostly pacing slightly higher than the global average. In this area, the long-term trend of global sea level rise is partially offset in areas like Maine by the rebound of the land surface following the retreat of ice sheets that covered the region during the last ice age.
On shorter time scales, sea levels in the U.S. Northeast are influenced by natural climate patterns, including the El Niño and La Niña pattern. As with the Mid-Atlantic, these climate patterns influence the local sea level through long-distance “teleconnections.” When El Niño is underway, it disrupts the entire circulation of the atmosphere over the tropics and mid-latitudes. Changes in the jet stream bring more frequent winter storms along the East Coast, raising sea level. During La Niña, storms are more likely to stay west of the Appalachians, reducing the frequency of storm-related surges in sea level.
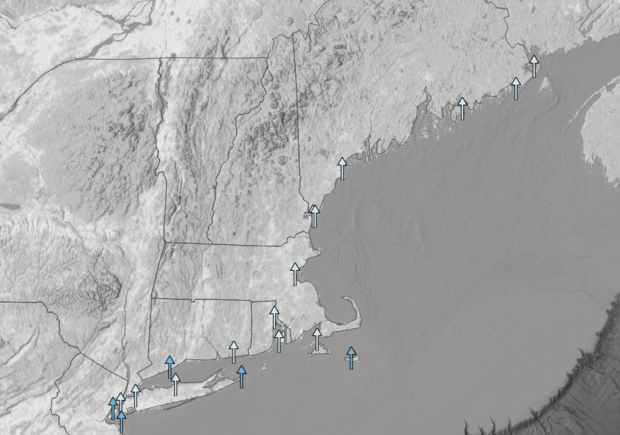
The influence of global sea level rise in the U.S. Northeast is being partially offset by rising land. Screenshot from Climate.gov/NOAA CO-COPS interactive map of local sea level trends.
A final natural influence on sea levels in the Northeast is the North Atlantic Oscillation (NAO). The NAO refers to an atmospheric see-saw in the North Atlantic between a low-pressure system near Iceland, and a high-pressure system near the Azores Islands. During its negative phase, when both the low pressure and high-pressure systems are weaker than normal, ocean water is pushed towards the Northeast, raising sea levels. Variability of the NAO on seasonal, yearly, and decadal time scales can therefore affect local sea levels across the region.
Impacts of sea level rise
Sea level rise isn’t just a problem for the future. It has already caused major increases in “nuisance flooding”—flooding during high tide even on sunny, storm-free days. It has made all kinds of storm-related surges higher than they would otherwise be, putting more people and property at risk. The problem is only going to get worse as the climate continues to warm.
To help American communities prepare for these challenges, NOAA recently released an updated summary of projected sea level rise in the United States for different time horizons ranging from a few decades to the next century. The near-term outlooks are based solely on the recent trends observed at the tide stations featured in this interactive. The United States is expected to experience as much sea level rise in the next 30 years as the country has seen during the span of the last century–an additional 10-12 inches by 2050, with specific amounts varying from place to place depending on the regional influences described in this article.
To explore projections of sea level rise based on the latest NOAA Technical Report, visit the Sea Level Rise tool. For maps showing what coastal areas would be flooded by different amounts of sea level rise and storm surges, visit the NOAA Sea Level Rise Viewer. For a collection of tools and resources for building climate resilience in coastal communities, visit the U.S. Climate Resilience Toolkit.
*The linear trends provided through this interactive map reflect the average rate of sea level change at these stations over their entire period of record. However, the rate of global sea level rise has accelerated since the 1970s, and the acceleration is evident at many U.S. locations. Using simple linear trends to estimate future change is likely to underestimate future sea level rise. So in a recent report on future sea level rise, a NOAA-led task force calculated 50-year trends that take into account the post-1970 acceleration. Then they extrapolated future sea level rise in coming decades based on those historical rates and accelerations. Those observation-based estimates were provided along with computer model projections of sea level change over the coming century.
Acknowledgements
The team brought sea level rise to life by animating what were once static mean sea level plots and trends. Julia Engdahl pioneered the effort of developing a Python technique to visualize data as an animation of sea level rise trends over time; making the data much more interactive and digestible. Chris Zervas had the idea to visualize relative sea level change by stacking annual sea level records, as an analogue to the warming stripes popularized for visualizing temperature change. Nate Murry developed additional GIS feature layers and web mapping applications, hosted this content on ArcGIS Online, and used Python to automate feature layer updates. Ashley Miller created and hosted the first feature layer to ArcGIS Online to connect animated plots of sea level trends to NWLON stations. Analise Keeney designed and formatted an accessible interface, facilitated meetings and coordinated outreach and communications. Audra Luscher and William Sweet outlined the regional differences monitored at NOAA tide gauges and contributions from land and ocean based processes.