NOAA-funded researcher Libby Barnes talks about the special challenges of forecasting in the gap between weather and climate
As Edward Lorenz famously said in 1972, the flap of a butterfly’s wings in Brazil could spark a series of complex atmospheric events, eventually causing a tornado in Texas. But just as it would be impossible to know in advance the exact moment when a butterfly would flap its wings a thousand miles away, it is impossible to know of all the atmospheric complexities leading to a specific extreme weather event at a given time and place. Weather events like a tornado form rapidly and change quickly, and even the tiniest—seemingly insignificant—differences in the state of the atmosphere at a point in time will change the final outcome: when, where, or even if that tornado or extreme rain event will form.
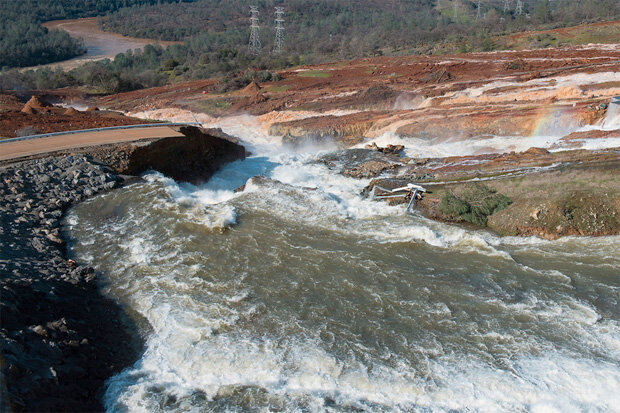
A view looking downhill from near the top of the Oroville Dam Auxiliary Spillway on February 12, 2017. Despite the erosion to the road and the surrounding landscape, the California Department of Water Resources reported that the flows posed no flood threat to the Feather River (visible at upper left) or other water channels downstream. The emergency spillway was used after a breach developed in the primary spillway several days earlier. Photo by Kelly M. Grow, California Department of Water Resources.
Since the 1960s, scientists have used the so-called "butterfly effect" to explain why we struggle to predict such extreme events with more than two weeks of advanced notice. But Elizabeth Barnes, Assistant Professor at Colorado State University, is pushing the envelope. Barnes likes making complex things simple, and with her team, she is turning the theory about Earth’s chaotic weather patterns on its head.
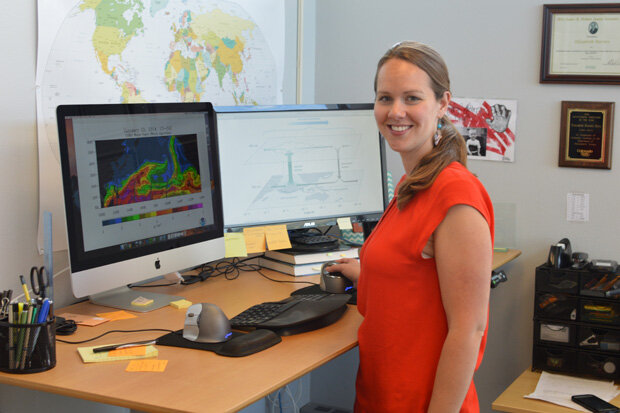
Assistant professor Libby Barnes at her desk at Colorado State University. On the monitors are images of some of her research interests: on the left a water vapor image of an "atmospheric river" in the Pacific Ocean; on the right, a diagram of atmospheric circulation in the tropical stratosphere. Image courtesy Libby Barnes.
Barnes has been simplifying complicated problems her whole life. Before the atmosphere, it was particle physics.
“I was 12 years old, and I saw the movie Contact with Jodie Foster,” Barnes said. Foster plays an astrophysicist in the movie. “I decided I was going to be an astrophysicist, too, even though I didn’t know what a physicist was.”
As a physics and math major at the University of Minnesota, Barnes spent her college summers studying neutrinos (nearly massless, neutral particles produced from events like exploding stars) at a high-energy particle accelerator, and at detectors throughout the United States. That was when she realized that, as a particle physicist, she might spend her whole life simplifying and finding an answer to the single question of how neutrinos change as they travel. Instead, Barnes knew she wanted to ask lots of questions about the most complicated system she could think of, the Earth system, which involves complex interactions between many of our planet’s components such as the atmosphere, ocean, and land.
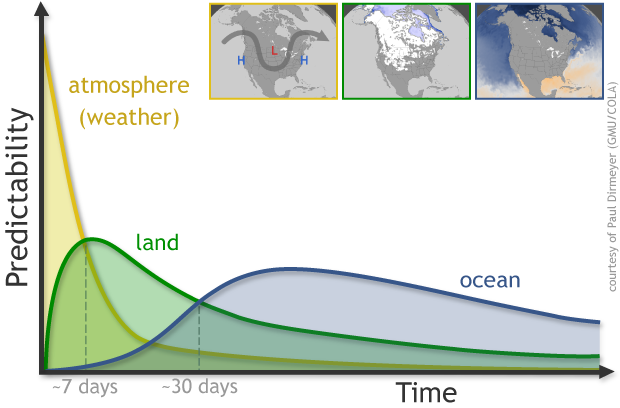
At different lead times (horizontal axis), different parts of the Earth's climate system (atmosphere, purple; land surface, green; ocean, blue) become more or less important to forecast skill (vertical axis). For short lead times, knowing the initial state of the atmosphere counts the most. At 2- to 4-week lead times, knowledge of the land surface is also needed, including things like soil moisture, snow cover, and vegetation. Forecasting more than 30 days ahead typically requires knowledge of the ocean, such as the sea surface temperature variations linked to El Niño. NOAA CLimate.gov graphic, adapted from original by Paul Dirmeyer.
Barnes then decided to obtain a Ph.D. in atmospheric science at the University of Washington. “Ever since I’ve been playing with really interesting questions and seeing what the Earth can tell us about how it works,” Barnes said.
One of the questions she’s focused on these days is whether we can overcome the butterfly effect and make better predictions for atmospheric rivers. These “rivers” of tropical moisture get their name because, from a satellite view, they look like rivers of water flowing across the sky from the tropics to the mid-latitudes. Also, the heavy rain or snow they cause can seem like a river of water pouring from the sky when they make landfall on the west coast of North America. Both a blessing and a curse, atmospheric rivers provide the west coast with 30–50% of its annual precipitation, but they also cause damaging floods as seen in California in early 2017.
Rivers of tropical moisture flowed from the western Pacific to California from January 15–January 31, 2016. This animation is based on satellite-based estimates of "total precipitable water," which is the amount of liquid water available in the atmosphere to fall as rain or snow. NOAA Climate.gov animation by Dan Pisut, NOAA Environmental Visualization Lab, based on data provided by the University of Wisconsin/SSEC MIMIC.
Because “upstream” atmospheric conditions can change so quickly, scientists struggle to predict atmospheric rivers beyond our current weather forecasting capability of seven to 10 days. But Barnes is trying to push through the butterfly effect. She wants to determine whether we can skillfully predict atmospheric rivers multiple weeks in advance by looking for “teleconnections”—long-distance relationships between the state of the atmosphere in one place, and the state in another place hundreds or even thousands of miles away.
Barnes and her colleagues at Colorado State University are finding that the answer may lie in the tropical ocean. One pattern in the tropics, called the Madden-Julian Oscillation (MJO), is particularly promising. The MJO is a disturbance of clouds and rain that circles the world every 30 to 90 days, beginning in the Indian Ocean. This large cluster of thunderstorms moves through the atmosphere like a whale through the ocean, making waves that meteorologists call “Rossby waves.”
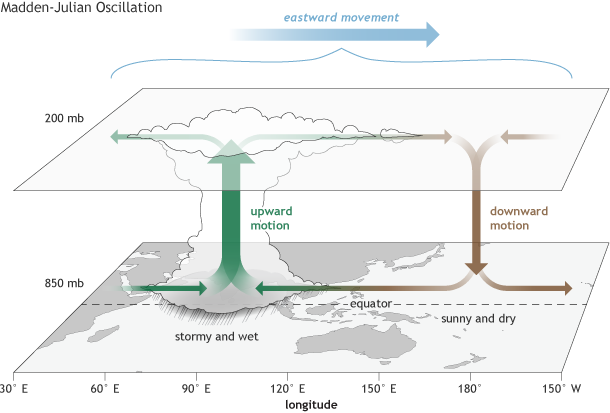
The surface and upper-atmosphere structure of the MJO for a period when the enhanced convective phase (thunderstorm cloud) is centered across the Indian Ocean and the suppressed convective phase is centered over the west-central Pacific Ocean. Horizontal arrows pointing left represent wind departures from average that are easterly, and arrows pointing right represent wind departures from average that are westerly. The entire system shifts eastward over time, eventually circling the globe and returning to its point of origin. Climate.gov drawing by Fiona Martin.
The exact location of the crests and troughs of these planet-spanning Rossby waves influence where and when heat and moisture move between the tropics and higher latitudes. When the MJO is in particular phases of its global trek, these Rossby waves can become nearly stationary, and the location of atmospheric high and low pressure systems can get stuck in a configuration that tends to block atmospheric rivers from making landfall in California. Instead, they are diverted towards the Gulf of Alaska.
As the cluster of storms and rainfall (green areas) known as the Madden-Julian Oscillation (MJO) travel around the tropics, they kick off planetary-scale waves in the mid-latitude atmosphere. Depending on the phase (location) of the MJO, the waves can alternately block or steer the flow of atmospheric rivers ("AR") around various high and low pressure systems and toward either the Gulf of Alaska or the U.S. West Coast . NOAA Climate.gov animation, by Cordelia Norris.
“We have this whole arc of how that tropical information may tell us something about weather extremes due to atmospheric rivers hopefully beyond the one- to two-week weather timescale,” Barnes said.
Barnes is applying this research to her role as lead of the NOAA-funded Subseasonal to Seasonal (S2S) Prediction Task Force. The goal of the S2S Prediction Task Force is to improve understanding and predictability of weather and climate phenomena falling within the two-week to two-month timescale. Past prediction efforts have mostly focused on forecasting either the weather timescale—days to one or two weeks in advance—or the seasonal climate timescale—two or three months ahead. However, accurately forecasting the time range in between is key to allow emergency and reservoir managers to prepare for many different extreme events such as heat waves, hurricanes, and atmospheric rivers.
“In terms of the actual science happening [in the task force], it’s all over the board, which makes it really exciting every time you talk to anyone on the task force,” Barnes said. “They might be thinking about completely different science questions than you, but what links you is your timescale.”
Task force projects cover topics like the stratosphere, MJO, ocean circulations, tropical cyclones, drought, and land-atmosphere interactions. As the task force lead, Barnes is aiming to help the group leverage each member’s efforts and integrate their research towards a broader goal.
The task force is already starting to find ways to bridge the weather-climate gap, and they are just getting started. As for Barnes’ particular question, she is looking for more phenomena in the Earth system that may hold information to help with atmospheric river forecasting. She has many more questions to ask but is optimistic about the progress so far in pushing the envelope and moving beyond the butterfly effect.
“We can actually tell you something about atmospheric river activity three weeks from now,” she said. “That would have been absolutely baffling two decades ago.”
Barnes is supported by the NOAA Modeling, Analysis, Predictions, and Projections (MAPP) Program and the National Weather Service Office of Science and Technology Integration.