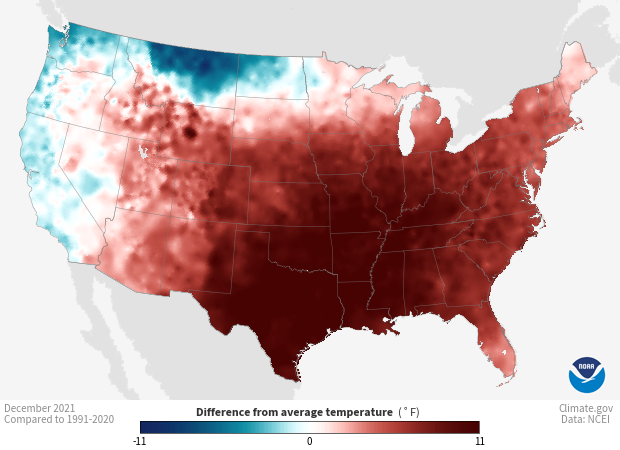
U.S. climate summary for January 2022
Following a record-warm December, the atmosphere seemed to remember in January that it was supposed to be winter in the United States. As detailed in the January climate summary from NOAA National Centers for Environmental Information, a series of storms brought significant snowfall to different parts of the East: a January 4 event that reached as far south as Arkansas, a January 16-17 event that blanketed areas from the Southern Appalachians to Maine, and a powerful nor'easter at the end of the month that left at least 100,000 resident of the Mid-Atlantic and Northeast without power.
All that storminess contributed to making January 2022 the coldest January since 2014, according to the Centers' monthly report. But what counts as a cool January has changed over time. The average temperature for the contiguous United States was 31.0°F, which is 0.9°F warmer than the 20th-century average. Alaska temperatures were warmer than average, but not extremely so: the average temperature of 3.9˚ F falls into the middle third of the state's historical record.
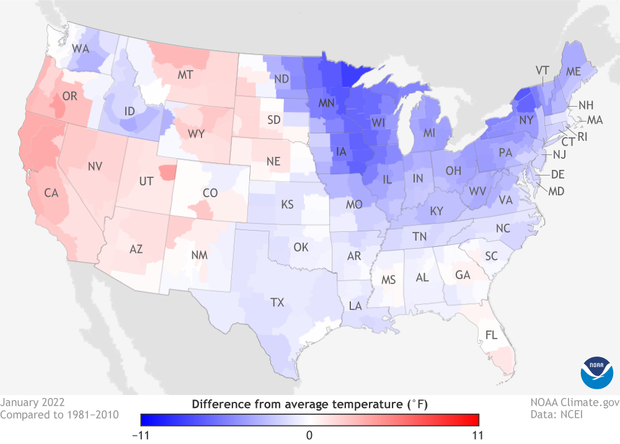
Average temperatures in U.S. climate divisions in January 2022 compared to the 1981-2010 average. Places that were warmer than average are red; places that were cooler than average are blue. NOAA Climate.gov map from our Data Snapshots collection, based on data from NOAA National Centers for Environmental Information.
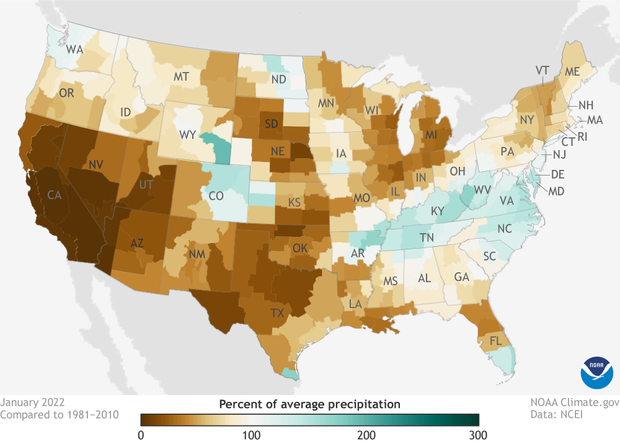
Precipitation in U.S. climate divisions in January 2022 as a percent of the 1981-2010 average. Places that were wetter than average are green; places that were drier than average are brown. NOAA Climate.gov map from our Data Snapshots collection, based on data from NOAA National Centers for Environmental Information.
Snowstorms notwithstanding, January 2022 was relatively dry across much of the country, as the map above shows. The average precipitation was 1.6 inches, which is 0.71 inch below average. That means precipitation across the contiguous United States was about 70% of average. The month tied with January 2009 as the 14th driest of the 128 years on record. The dry conditions didn't extend to Alaska, however, which ranked in the wettest third of the historical record.
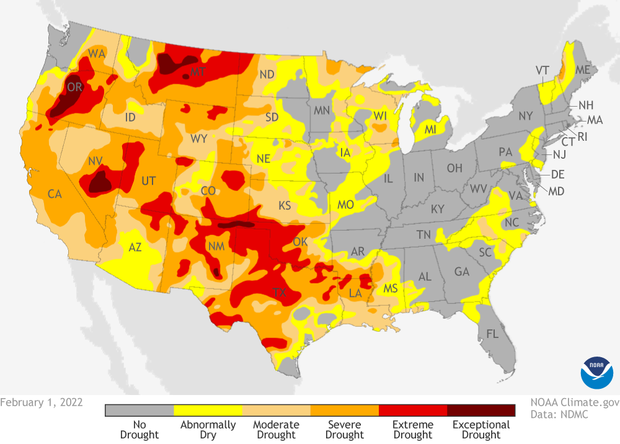
Drought status across the contiguous United States as of February 1, 2022. Virtually the entire West was in some level of drought. NOAA Climate.gov map from our Data Snapshots collection, based on data from NOAA National Centers for Environmental Information.
More than half of the contiguous United States was in some level of drought at the end of January, including an expansion or intensification of drought in parts of the Great Plains and Lower Mississippi. But there was good news for some parts of the West, where drought has been in place for more than a year in places. For more drought information, visit Drought.gov.
For more details on the January and winter-to-date climate for the United States, read the Centers' U.S. climate summary for January.