2020 Arctic Report Card: Climate.gov visual highlights
Sea ice loss, and extreme wildfires mark another year of Arctic change
Fifteen years of observations document impact of changing polar climate
The Arctic Report Card is an annual compilation of original, peer-reviewed environmental observations and analyses of a region undergoing rapid and dramatic alterations to weather, climate, oceanic, and land conditions. Compiled by 133 scientists from 15 countries, the 2020 report card tracks environmental indicators to inform decisions by local, state and federal leaders confronting a rapidly changing climate and ecosystems. It was released today during a virtual press conference hosted by the American Geophysical Union as part of its fall meeting. Read the full press release.
Below is a collection of graphics that highlights some of the key findings of the 2020 Arctic Report Card. Or you can explore the 2020 Arctic Report Card.
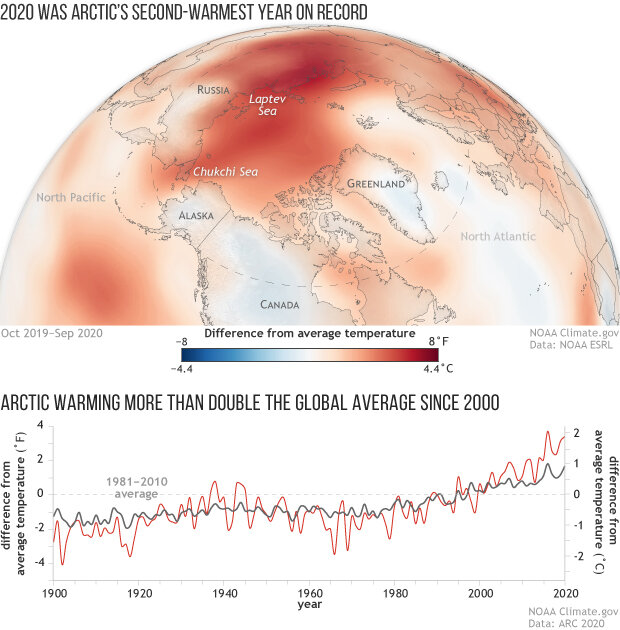
(top) Near-surface air temperatures across the Arctic from October 2019–September 2020 compared to the 1981-2010 average. Most of the Arctic was warmer than average (red), with only a few places colder than average (blue). Map by NOAA Climate.gov, based on NCEP/NCAR Reanalysis data from the Physical Sciences Lab at NOAA ESRL. (bottom) Annual temperatures over land in the Arctic (red) versus the globe (dark gray) compared to the 1981-2010 average from 1900–2020. Graph by NOAA Climate.gov, adapted from the 2020 Arctic Report Card.
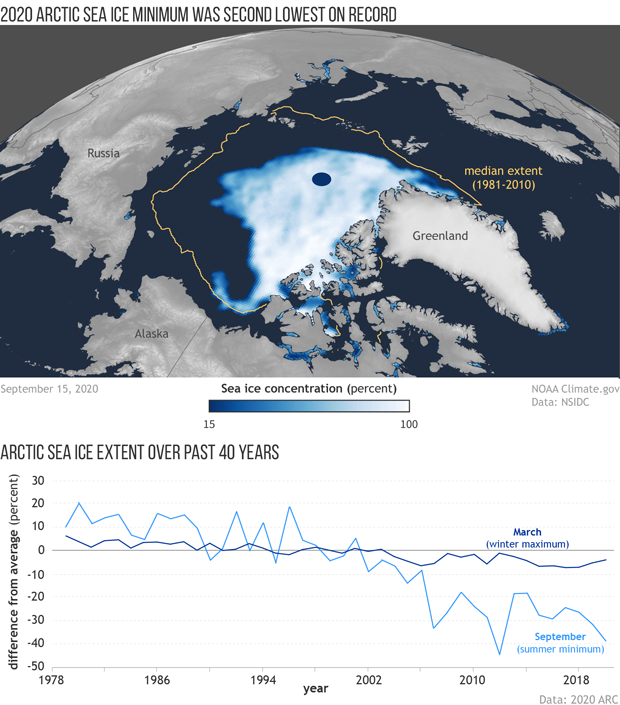
(top) Arctic sea ice concentration on September 15, 2020—the day of the smallest extent of the year—compared to the median extent (gold line) reached on this date in Septembers from 1981 to 2010. (bottom) Annual maximum (dark blue) and minimum (light blue) ice extents from 1979 to 2020. NOAA Climate.gov, based on data from the National Snow and Ice Data Center and the 2020 Arctic Report Card. Full story.
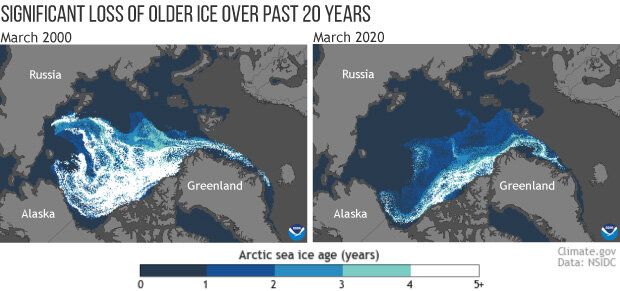
The age of sea ice in the Arctic at winter maximum in 2000 (left, week of March 18) and 2020 (right, week of March 21). Ice older than 5 years (white) is very rare today; only a small ribbon remains along the islands of the Canadian Arctic. Age is a stand-in for ice thickness and durability; young ice is thinner and more likely to melt in the summer. NOAA Climate.gov map, based on data from the National Snow and Ice Data Center.
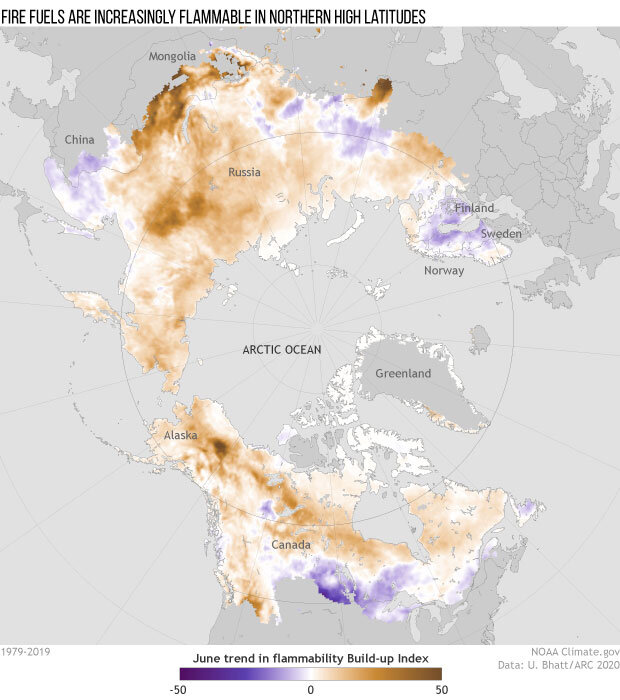
Rising surface temperatures have made fire fuels in Northern Hemisphere high latitudes more flammable over the past 40 years. This map shows the June trend (1979–2019) in the Build-up Index, an element of the Canadian Forest Fire Danger Rating System that uses weather data to estimate the dryness of fuels. Brown indicates increasing flammability; purple indicates decreasing flammability. NOAA Climate.gov map, adapted from the 2020 Arctic Report Card. Full story.
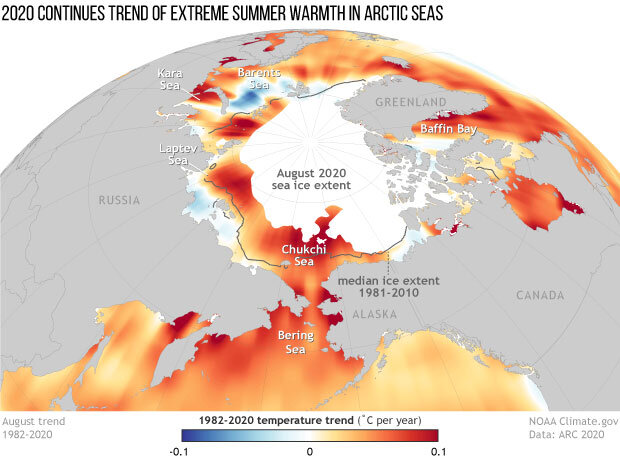
Sea surface temperature trends in the Arctic from 1982–2020, showing where waters are warming (red and orange) and where they are cooling (blue). The gray line shows the median August sea ice extent, and the white areas show the ice extent in August 2020. NOAA Climate.gov map by Hunter Allen, based on data from Mary-Louise Timmermans and Zachary Labe.
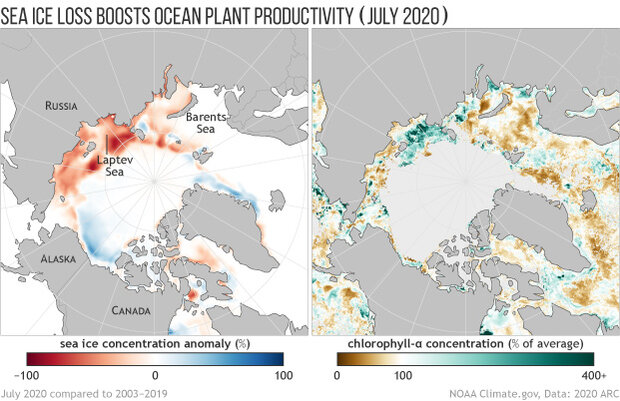
(left) Sea ice concentration in July 2020 compared to the 2003–2019 average. Red areas had up to 100% less than their average sea ice, while blue regions had up to 100% more ice than average. (right) Chlorophyll amounts—an indicator of ocean plant productivity—in July 2020 as a percent of the 2003–2019 average. Very low sea ice in the Laptev Sea in July was linked to much higher than average phytoplankton productivity (deep green). NOAA Climate.gov map by Mary Lindsey, adapted from the 2020 Arctic Report Card, based on data provided by Karen Frey.
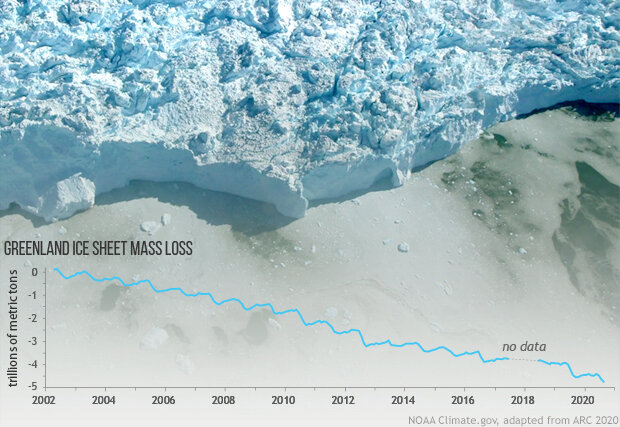
The Greenland Ice Sheet lost mass again in 2020, but not as much as it did 2019. Adapted from the 2020 Arctic Report Card, this graph tracks Greenland mass loss measured by NASA's GRACE satellite missions since 2002. The background photo shows a glacier calving front in western Greenland, captured from an airplane during a NASA Operation IceBridge field campaign. Full story.