2024 Arctic Report Card documents rapid, dramatic change

After storing carbon dioxide in frozen soil for millennia, the Arctic tundra is being transformed by frequent wildfires into an overall source of carbon to the atmosphere, which is already absorbing record levels of heat-trapping fossil fuel pollution.
The transition of the Arctic tundra from a carbon sink to a carbon source is one of the dramatic changes in the Arctic that are documented in NOAA’s 2024 Arctic Report Card. Climatic shifts are forcing plants, wildlife and the people that depend on them to rapidly adapt to a warmer, wetter and less certain world.
“Our observations now show that the Arctic tundra, which is experiencing warming and increased wildfire, is now emitting more carbon that it stores, which will worsen climate change impacts,” said NOAA Administrator Rick Spinrad, Ph.D. “This is yet one more sign, predicted by scientists, of the consequences of inadequately reducing fossil fuel pollution.”
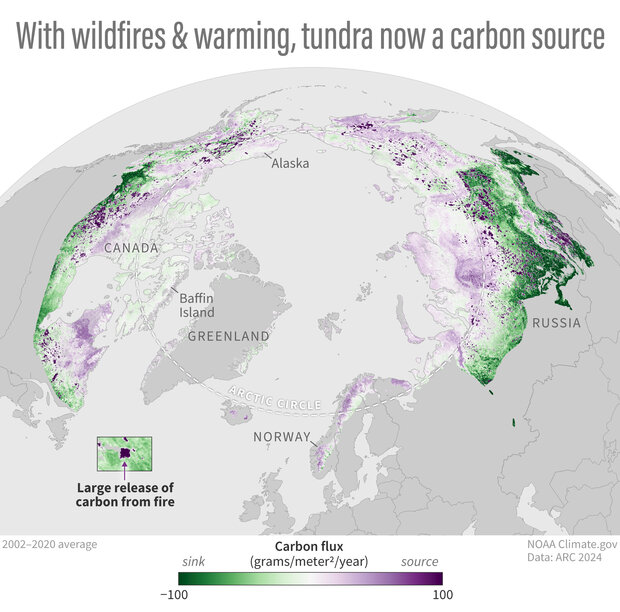
This map shows the Arctic's average carbon balance from 2002-2020. Land areas colored purple were a source of carbon dioxide to the atmosphere. The darkest purple clusters show areas where there were large releases due to wildfires. Green areas had a negative carbon dioxide flux, meaning they were a “sink” that removed and stored atmospheric carbon dioxide. NOAA Climate.gov image based on the 2024 Arctic Report Card - Carbon Cycling. Large image & full story
New research in the 2024 Arctic Report Card, contributed by 97 scientists from 11 countries, reveals record-setting observations that underlie ongoing changes emerging in the Arctic, which covers the lands and seas of the north polar region. They include:
- Continuing high air temperatures and wildfires.
- Declines of large inland caribou herds.
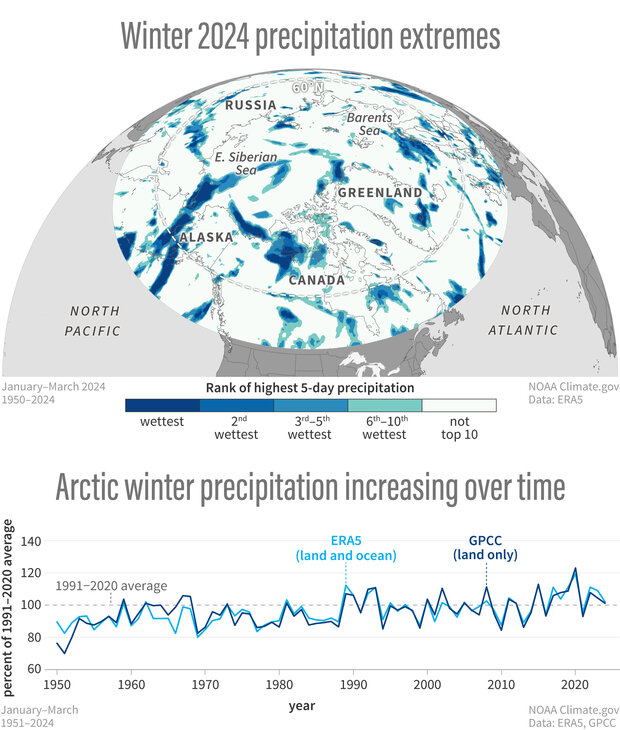
- Increasing precipitation, including rain-on-snow events that coat the landscape in an icy shell, making travel difficult for people and foraging challenging for wildlife.
(top) On the map, blues and greens shows locations where the heaviest 5-day winter precipitation events in 2024 ranked in the top 10 wettest events on record (1950-2023). (bottom) The graph shows winter precipitation each year from 1950–2023 from two data sources, both confirming a long-term increase. NOAA Climate.gov image, based on the 2024 Arctic Report Card - Precipitation. Large image & full story
Observations also reveal stark regional differences that make local and regional environmental shifts highly unpredictable for people, plants and animals.
“This year’s report demonstrates the urgent need for adaptation as climate conditions quickly change,” said Twila Moon, lead editor of the Arctic Report Card and deputy lead scientist at the National Snow and Ice Data Center. “Indigenous Knowledge and community-led research programs can inform successful responses to rapid Arctic changes.”
Notable findings from the 2024 Arctic Report Card
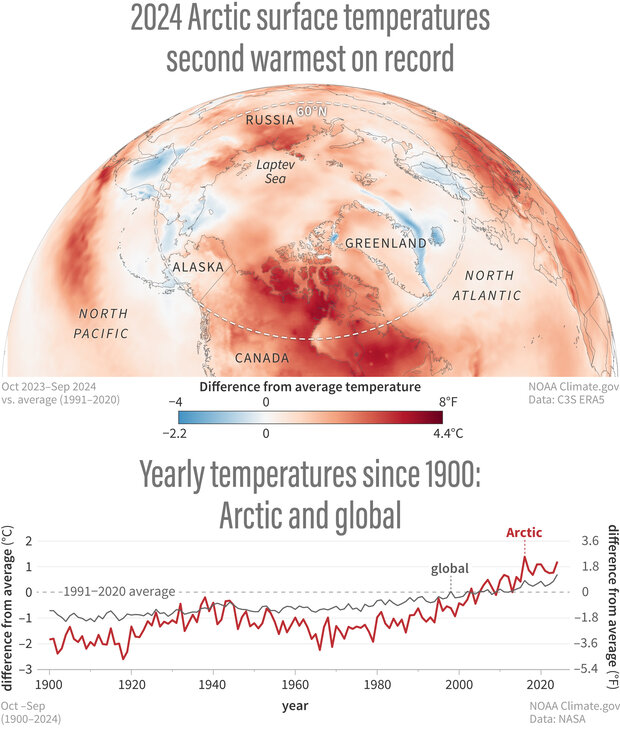
(top) Map of average air temperature across the Arctic for October 2023–September 2024 compared to the 1991–2020 average. Areas with warmer-than-average temperatures are orange and red, and areas with colder-than-average temperatures are blue. The graph shows how yearly Arctic (red line) and global (gray line) temperatures compared to the long-term average (1991-2020) from 1900–2024. NOAA Climate.gov image based on the 2024 Arctic Report Card - Surface Air Temperature. Large image & full story
In the air
- Arctic annual surface air temperatures ranked second-warmest since 1900.
- The last nine years are the nine warmest on record in the Arctic.
- Autumn 2023 and summer 2024 were especially warm across the Arctic, with temperatures ranking 2nd and 3rd warmest, respectively.
- An early August 2024 heatwave set all-time record daily temperatures in several northern Alaska and Canada communities.
- Summer 2024 across the Arctic was the wettest on record.
In the ocean
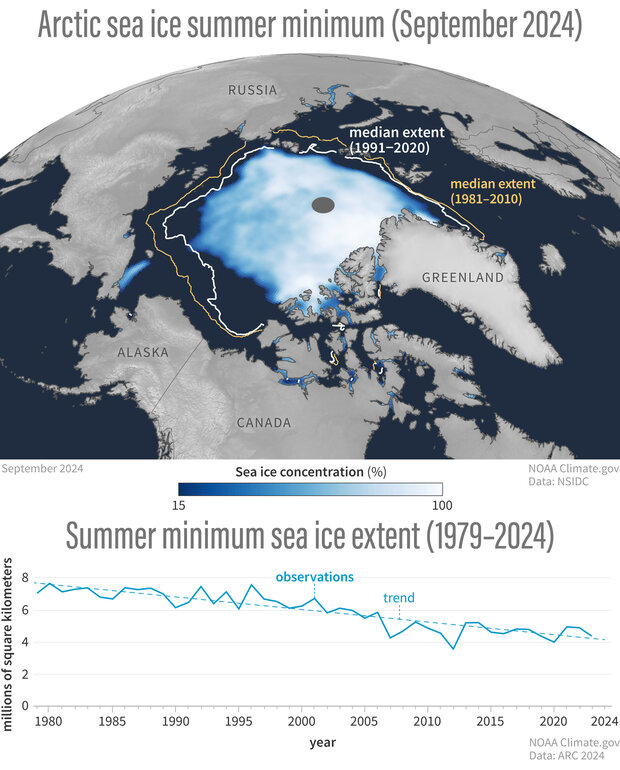
(top) This map shows average sea ice concentration in September 2024. The ice pack was smaller than median ice extent from 1991–2020 (white line) and much smaller than the median ice extent from 1981–2010. (bottom) The graph shows the observed ice extent each September from 1979–2024 (solid line) and the trend line (dashed line). NOAA climate.gov image based on the 2024 Arctic Report Card - Sea Ice. Large image & full story
- In September 2024, the extent of Arctic sea ice, which has a profound influence on the polar environment, was the sixth-lowest in the 45-year satellite record.
- All 18 of the lowest September minimum ice extents have occurred in the last 18 years.
- Arctic Ocean regions that were ice-free in August have been warming at a rate of 0.5 degrees F (0.3 degrees C) per decade since 1982.
- In most of the shallow seas that ring the Arctic Ocean, August mean sea surface temperatures were 3.6–7.2 degrees F (2–4 degrees C) warmer than 1991-2020 averages, while the Chukchi Sea were 1.8–7.2 degrees F (1–4 degrees C) cooler than average.
- Plankton blooms — the base of the marine food chain — continue to increase in all Arctic regions, except for the Pacific Arctic, throughout the observational record of 2003–2024. However, in 2024, lower-than-average values were dominant across much of the Arctic.
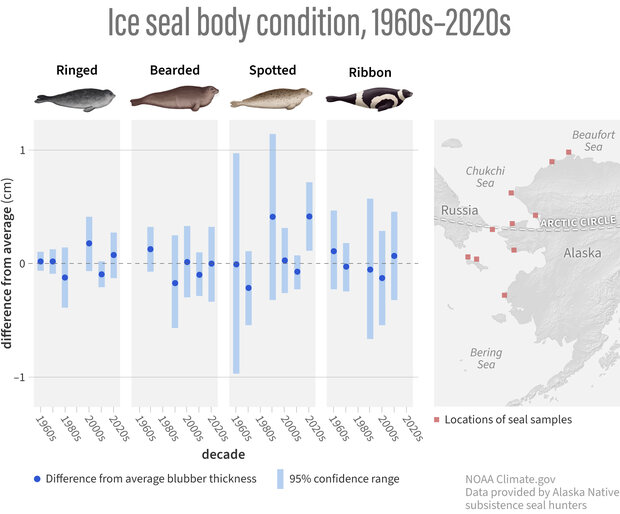
- Ice seal populations remain healthy in the Pacific Arctic, though their diets are shifting from Arctic cod to saffron cod with warming waters.
(left) A graph of blubber thickness compared to average (dots show the average, bars shows the 95% confidence range) since the 1960s in four types of ice seals harvested by Alaska Natives. Following declines in the 2010s, the body condition of ringed, bearded, spotted, and ribbon seals has recovered. (right) The map shows the locations (red squares) around the Pacific Arctic where hunters harvested the seals. NOAA Climate.gov image based on the 2024 Arctic Report Card - Ice Seals. Large image & full story
On land
- When including the impact of increased wildfire activity, the Arctic tundra region has shifted from storing carbon in the soil to becoming a carbon source to the atmosphere. Circumpolar wildfire emissions have averaged 207 million tons of carbon per year since 2003.
- The Arctic remains a consistent methane source.
- Alaskan permafrost temperatures were the second warmest on record.
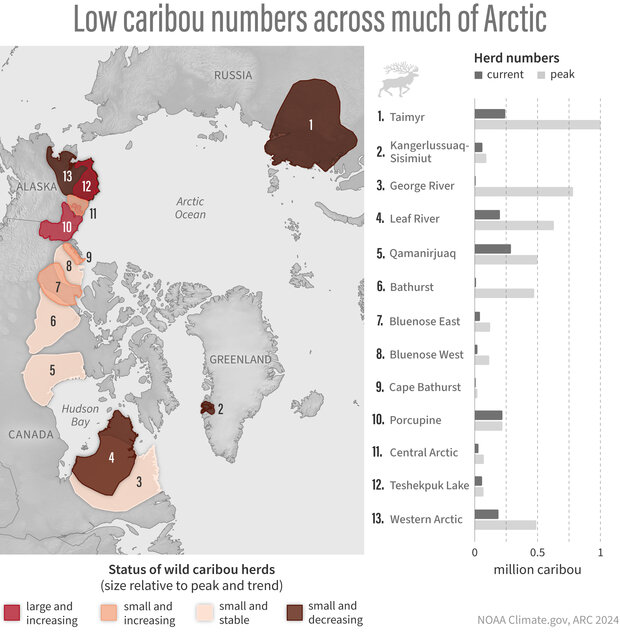
- Arctic migratory tundra caribou populations have declined by 65% over the last 2-3 decades. Though the generally smaller coastal herds of the western Arctic have seen some recovery over roughly the last decade, large inland caribou herds are continuing a long-term decline or remain at the lowest populations noted by Indigenous elders.
(left) Map shows the location and status of 13 caribou herds relative to their peak; large and increasing (red), small and increasing (dark peach), small and stable (light peach), and small and decreasing (brown). (right) The graph shows each herd’s population (dark gray) compared to their historic high numbers (light gray). NOAA Climate.gov image, based on the 2024 Arctic Report Card - Caribou. Large image & full story
- Summer heat impacts on caribou herds are projected to magnify over the next 25-75 years, requiring shared knowledge between scientists and Indigenous communities for management strategies.
- Snow accumulation during the 2023-2024 winter was above average across both the Eurasian and North American Arctic.
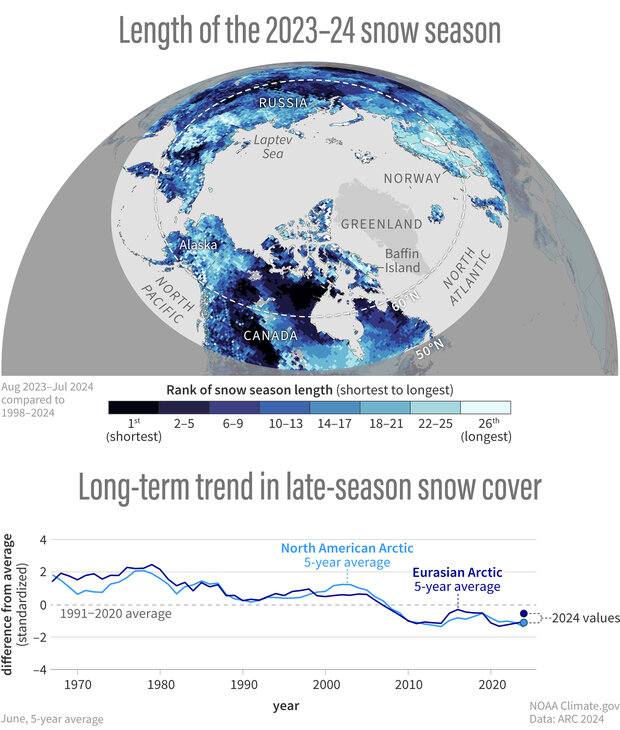
- Despite above-average snow accumulation, the snow season was the shortest in 26 years over portions of central and eastern Arctic Canada. Arctic snow melt is occurring 1-2 weeks earlier than historical conditions throughout May and June.
(top) Map showing the length of the 2023-24 snow season across the Arctic ranked from shortest (dark blue) to longest (light blue) in the recent record (1998-2024). (bottom) Five-year average June snow cover extent since 1967 compared to the 1991-2020 average. Late-spring snow cover has declined across the North American Arctic (bright blue) and the Eurasian Arctic (dark blue). NOAA Climate.gov image based on the 2024 Arctic Report Card - Snow Cover. Large image & full story
- Greenland Ice Sheet mass loss was the lowest since 2013.
- Tundra greenness, a measure of expanding shrub cover due to warming temperatures, ranked second highest in the 25-year satellite record.
“Many of the Arctic’s vital signs that we track are either setting or flirting with record-high or record-low values nearly every year," said Gerald (J.J.) Frost, senior scientist with Alaska Biological Research, Inc. and veteran Arctic Report Card author. "This is an indication that recent extreme years are the result of long-term, persistent changes, and not the result of variability in the climate system.”
