April 2022 U.S. Climate Outlook: Warmth favored for the southern and eastern U.S.
Spring is a season of contrasts. One day, you could be basking under summer-like warmth. The next day, you may be shaking your fist at the cloudy sky as a chilly rain falls on your head. Which of those outcomes is most likely where you are for the month of April as a whole? Let’s look at the April 2022 climate outlook from NOAA’s Climate Prediction Center.
Temperatures are favored to be well above average for the southern and eastern United States and well below average for the Pacific Northwest. For precipitation, much drier than average conditions are once again favored for the Southwest, while a much wetter than average April is most likely for the Great Lakes, Northeast, and Pacific Northwest.
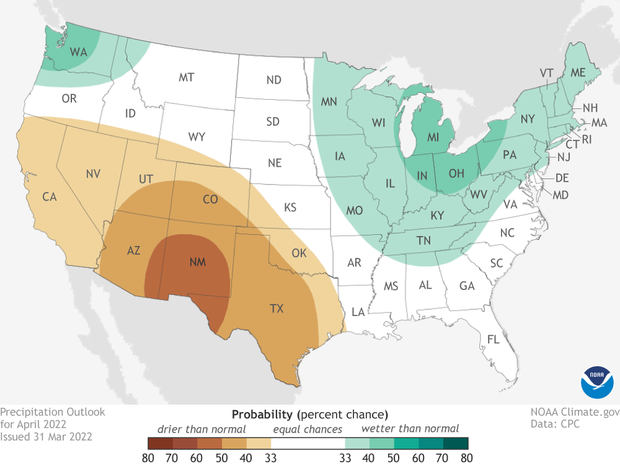
Map of the contiguous United States (view Alaska) showing which of three precipitation outcomes—much wetter than average (green), average, or much drier than average (brown)—are most likely for the month of April 2022. Darker colors mean greater chances, not how far above or below average precipitation is likely to be. White does not mean "average." It means a wet, dry, or near-average April are all equally likely. NOAA Climate.gov image, based on data from the Climate Prediction Center.
A reminder: the climate outlook maps are not a forecast for the absolute temperature or precipitation amounts in April. Instead, they are the probability (percent chance) that monthly average temperature or precipitation will be in the upper, middle, or lower third of the climatological record (1991-2020) for April. We refer to these categories as “well above” and “well below” average.
The colors (red or blue for temperatures, brown or teal for precipitation) indicate which outcome is the most likely. Darker colors reflect higher chances of a given outcome, not more extreme conditions. White does not mean average conditions are favored; it means above-, below-, or near-average conditions are equally likely. Head to the end of this post for more on the math behind the outlooks, including how experts calculate the probability of the less likely (but still possible!) outcomes.
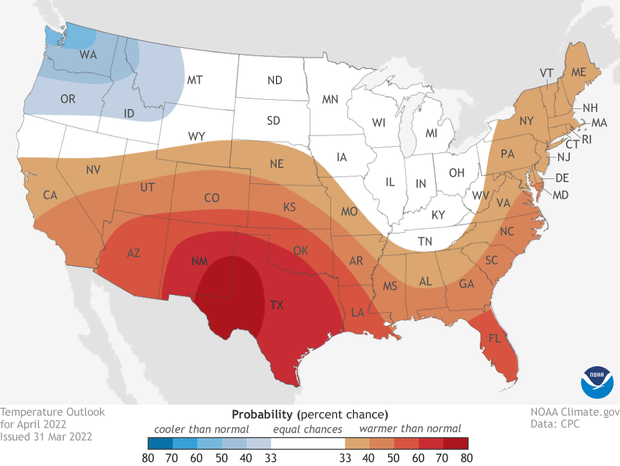
Map of the contiguous United States (view Alaska) showing which of three temperature outcomes—much warmer than average (red), average, or much cooler than average (blue)—are most likely for the month of April. Darker colors mean greater chances, not bigger temperature extremes. White does not mean "average." It means a warm, cool, or near average April are all equally likely. NOAA Climate.gov image, based on Climate Prediction Center data.
Warmth across the southern and eastern U.S.
The outlook for the second month of spring favors a warmer-than-average month for much of the country including the southern and eastern U.S., as well as the central Plains. The only part of the contiguous United States favored for a cooler-than-average April is across the Pacific Northwest.
The pattern of warmth across the southern tier of the country along with cooler-than-average temperatures favored for the Pacific Northwest bears the hallmarks of the influence of La Niña, which is still ongoing across the Pacific Ocean. This set-up combined with a weekly forecast for above-average temperatures across the Southwest at the start of the month made it easier for forecasters to decide to favor above-average temperatures across such a broad area.
Map of the contiguous United States (view Alaska) showing which of three precipitation outcomes—much wetter than average (green), average, or much drier than average (brown)—are most likely for the month of April 2022. Darker colors mean greater chances, not how far above or below average precipitation is likely to be. White does not mean "average." It means a wet, dry, or near-average April are all equally likely. NOAA Climate.gov image, based on data from the Climate Prediction Center.
Dryness favored for the already dry Southwest, with a wetter-than-average month for the Midwest and Northeast
The precipitation outlook favors a dry/wet contrast between the Southwest and the Great Lakes/Northeast for the month of April, along with an elevated chances for a wetter-than-average month for the Pacific Northwest.
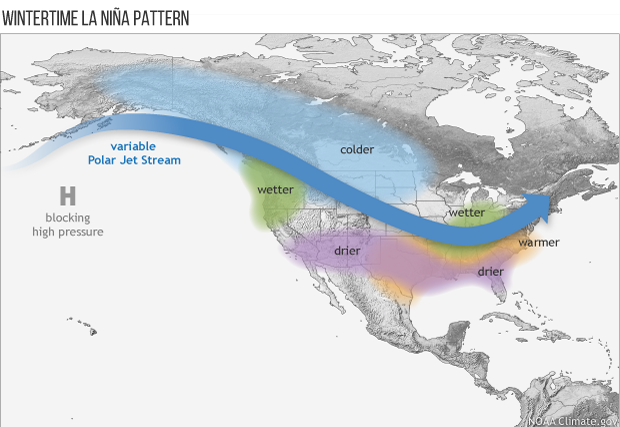
Average location of the jet stream and typical temperature and precipitation impacts during La Niña winter over North America. Map by Fiona Martin for NOAA Climate.gov.
Again, this pattern of dryness in the south and wetness across the Pacific Northwest is consistent with the influence of La Niña. Meanwhile, the wet signal across the Great Lakes, northern Mississippi Valley, and Northeast is due in part to a wet forecast for the first week of the month. While one wet week will not guarantee that the monthly precipitation totals will be above average, it does at least tilt the odds In that direction.
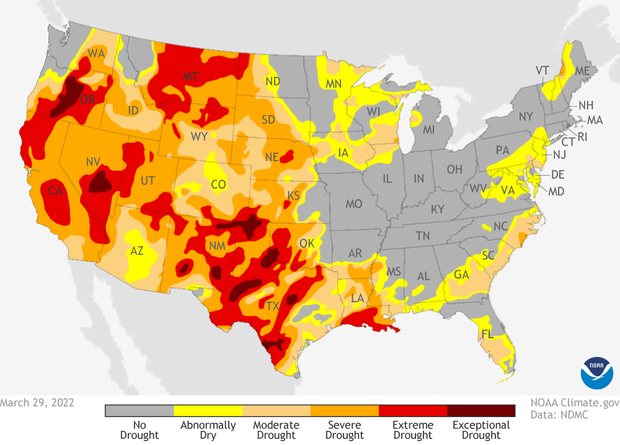
Drought conditions across the contiguous United States as of March 29, 2022. Areas colored dark red indicate the most severe level of drought. Climate.gov map from Data Snapshots, based on data from the U.S. Drought Monitor/Drought.gov.
Western drought continues
As of March 29, 2022, it’s clear that western drought continues almost unabated, as nearly 58% of the country remains in drought. Over 17% of the country is in the two worst categories of drought, extreme and exceptional (D3-4). Across the epicenter of the drought, the West, nearly 89% of the region is in drought, with a third in D3-4 drought. Those numbers actually reflect a 10% rise in areas under D3-4 drought over the last month across the West.
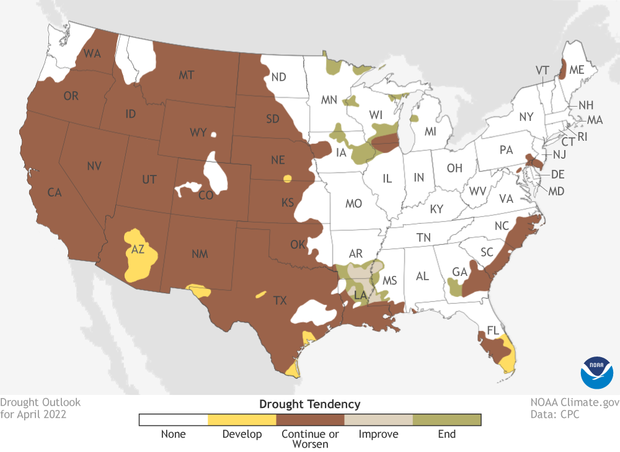
Drought forecast for the Lower 48 U.S. states in April 2022. Brown indicates areas where experts believe drought will persist or worsen. Green areas mean drought is likely to end. Climate.gov map from Data Snapshots, based on data from the Climate Prediction Center.
For the next month, drought improvement is unlikely across the West. The climate outlook favors a drier-than-average month across the southern tier and, as a result, drought development is likely across Arizona, Colorado, and Texas.
The one area of good news is across northern Louisiana and southern Missouri, where drought improvement or removal is favored during the upcoming month.
To read the entire discussion of the monthly climate outlooks from the Climate Prediction Center, check out their website. And head back to Climate.gov later this month for a United States and global climate recap of March 2022.