Climate change: global temperature
Global temperature in 2024
According to the annual report from NOAA National Centers for Environmental Information, 2024 was the warmest year since global records began in 1850. The global average surface temperature was 2.32 Fahrenheit (1.29 degrees Celsius) above the 20th-century average (57.0 degrees Fahrenheit, or 13.9 degrees Celsius) and 2.63 degrees Fahrenheit (1.46 degrees Celsius) above the pre-industrial average (56.7 degrees Fahrenheit, or 13.7 degrees Celsius), which NOAA defines as the period from 1850-1900.
Global temperatures in 2024 were above the 1991-2020 average (red) across most of the planet. Yearly temperatures compared to the 20th-century average (bar chart) show that it has been 48 years since Earth had a cooler-than-average year. NOAA Climate.gov image, based on data from NOAA National Centers for Environmental Information.
The 2024 global temperature anomaly (anomaly means “difference from average”) is 0.18 degrees F (0.10 degrees C) warmer than the previous record, set the year before, in 2023. The ten warmest years in the 175-year record have all occurred during the last decade (2015–2024). When the new century started in 2000, the first year to set a new high-temperature record was 2005. Now, 2005 is just the 13th-warmest year on record.
Other 2024 rankings included...
- warmest year on record for both the Northern and Southern Hemispheres individually,
- warmest year on record for land and ocean areas individually,
- upper ocean heat content was highest on record.
For more regional details and 2024 climate statistics, see the 2024 Global Climate Report from NOAA's National Centers for Environmental Information.
Why global surface temperature matters
The global average surface temperature is an indicator of the state of Earth’s energy balance: how much sunlight it absorbs minus how much heat it radiates back to space. When these amounts are the same, Earth’s average surface temperature remains steady. When they are out of balance, Earth cools or warms. Earth’s average surface temperature has been rising because human-produced greenhouse gases are causing Earth to absorb more energy than it radiates back to space.
Given the tremendous size and heat capacity of the global oceans, it takes a massive amount of added heat energy to raise Earth’s average surface temperature even a small amount. The roughly 2-degree-Fahrenheit (1-degree-Celsius) increase in global average surface temperature that has occurred since the pre-industrial era (1850-1900 in NOAA's record) might seem small, but it represents a significant increase in heat energy circulating through all parts of the Earth system, including the oceans, frozen landscapes, and the atmosphere.
Beyond being an indicator of changes in Earth’s energy balance, surface temperature matters because it controls many environmental and ecological processes that are important to humans and other life, including the water cycle (evaporation, clouds, surface water supplies, and precipitation), the carbon cycle, and the kinds of plants, animals, and other living things that can survive in different places on Earth.
About surface temperature
The concept of an average temperature for the entire globe may seem odd. After all, at this very moment, the highest and lowest temperatures on Earth are likely more than 100 degrees Fahrenheit (55 degrees Celsius) apart. Temperatures vary from night to day and between seasonal extremes in the Northern and Southern Hemispheres. This means that some parts of Earth are quite cold while other parts are downright hot. To speak of the "average" temperature, then, may seem like nonsense. However, the concept of a global average temperature is convenient for detecting and tracking changes in Earth's energy budget, which can only be directly measured from space.
To calculate a global average temperature, scientists begin with temperature measurements taken at locations around the globe. Because their goal is to track changes in temperature, measurements are converted from absolute temperature readings to temperature anomalies—the difference between the observed temperature and the long-term average temperature for each location and date. Multiple independent research groups across the world perform their own analysis of the surface temperature data, and they all show a similar upward trend.
Across inaccessible areas that have few measurements, scientists use surrounding temperatures and known physical relationships—such as the way temperature decreases with altitude—to estimate the missing values. Each value is then used to calculate a global-scale temperature anomaly. This process provides a consistent, reliable method for monitoring changes in Earth's surface temperature over time. Read more about how the global surface temperature record is built in our Climate Data Primer.
Past and future change in global temperature
Temperature change has not been uniform across the planet, but more areas are warming than cooling. And the rate of warming has accelerated in recent decades. According to NOAA's 2024 Annual Climate Report the combined land and ocean temperature has warmed at an average rate of 0.11 degrees Fahrenheit (0.06 degrees Celsius) per decade since 1850 and more than three times that rate (0.36 degrees Fahrenheit, or 0.20 degrees Celsius) per decade since 1975.
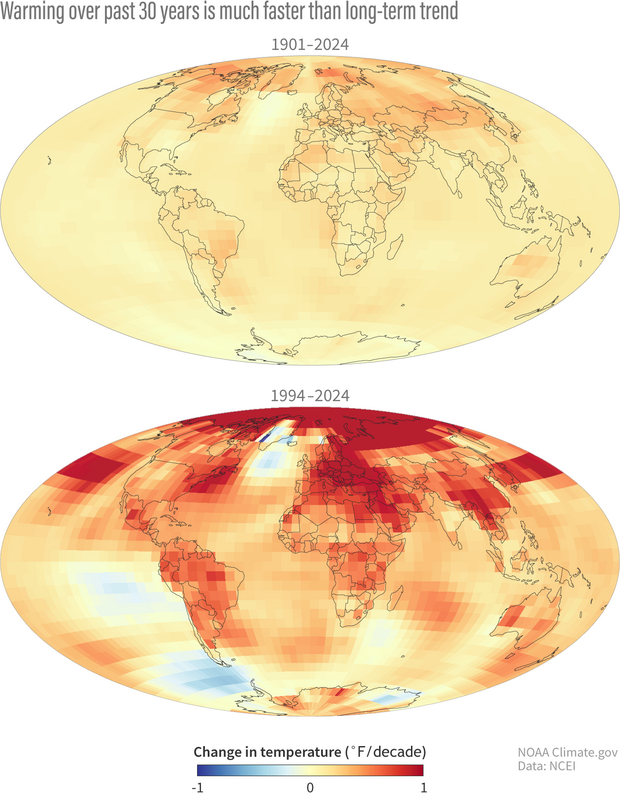
Recent rates of global warming (1994-2024, bottom) are larger than the longer-term average rates (1901-2024, top). Places that have cooled are colored blue; places that have warmed are colored yellow, orange, or red. In the past three decades, many places in the Northern Hemisphere have warmed by 1 degree Fahrenheit or more per decade. Differences are most dramatic in the Arctic. With the decline of ice and snow, the Arctic reflects less incoming sunlight, which amplifies the rate of greenhouse-gas-driven warming. NOAA Climate.gov, based on data provided by NOAA National Centers for Environmental Information.
According to the latest Synthesis Report (pdf) from the Intergovernmental Panel on Climate Change, there is no debate about the cause of this warming trend:
Human activities, principally through emissions of greenhouse gases, have unequivocally caused global warming, with global surface temperature reaching 1.1°C above 1850-1900 in 2011-2020.
In the IPCC's Sixth Assessment Report on the Physical Basis of Climate Change, experts summarized the relative influence of all things known to affect Earth's average surface temperature:
The likely range of total human-caused global surface temperature increase from 1850–1900 to 2010–2019 is 0.8°C to 1.3°C, with a best estimate of 1.07°C [2.01 ˚F]. Over this period, it is likely that well-mixed greenhouse gases (GHGs) contributed a warming of 1.0°C to 2.0°C, and other human drivers (principally aerosols) contributed a cooling of 0.0°C to 0.8°C, natural (solar and volcanic) drivers changed global surface temperature by –0.1°C to +0.1°C, and internal variability changed it by –0.2°C to +0.2°C.
The amount of future warming Earth will experience depends on how much carbon dioxide and other greenhouse gases we emit in coming decades. Today, our activities—burning fossil fuels and to a lesser extent clearing forests—add about 11 billion metric tons of carbon (equivalent to a little over 40 billion metric tons of carbon dioxide) to the atmosphere each year. Because that is more carbon than natural processes can remove, atmospheric carbon dioxide amounts increase each year.
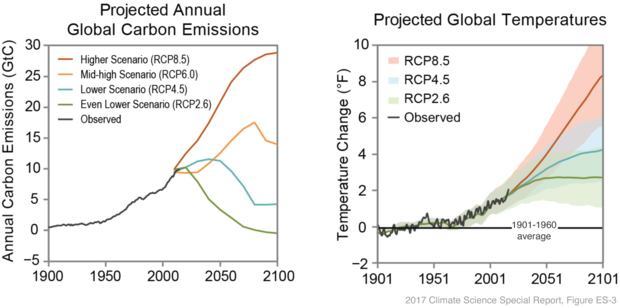
According to the 2017 U.S. Climate Science Special Report, if yearly emissions continue to increase rapidly, as they have since 2000, models project that by the end of this century, global temperature will be at least 5 degrees Fahrenheit warmer than the 1901-1960 average, and possibly as much as 10.2 degrees warmer. If annual emissions increase more slowly and begin to decline significantly by 2050, models project global temperatures would still be at least 2.4 degrees warmer than the first half of the 20th century, and possibly up to 5.9 degrees warmer.
Key resources
- Climate at a Glance for NOAA global and national surface temperature maps, graphs, and underlying data.
- Maps of U.S. temperature and precipitation trends.
- The Climate Explorer for U.S. county-level maps and time series of past and future temperatures and climate impacts.
References
Global Carbon Project. (2024, November 13). Fossil fuel CO2 emissions increase again in 2024. Accessed May, 21, 2025, from https://globalcarbonbudget.org/fossil-fuel-co2-emissions-increase-again….
NOAA National Centers for Environmental Information (2024). Annual 2024 Global Climate Report. Accessed May 21, 2025, from https://www.ncei.noaa.gov/access/monitoring/monthly-report/global/202413.
IPCC, 2021: Summary for Policymakers. In: Climate Change 2021: The Physical Science Basis. Contribution of Working Group I to the Sixth Assessment Report of the Intergovernmental Panel on Climate Change [Masson-Delmotte, V., P. Zhai, A. Pirani, S.L. Connors, C. Péan, S. Berger, N. Caud, Y. Chen, L. Goldfarb, M.I. Gomis, M. Huang, K. Leitzell, E. Lonnoy, J.B.R. Matthews, T.K. Maycock, T. Waterfield, O. Yelekçi, R. Yu, and B. Zhou (eds.)]. Cambridge University Press, Cambridge, United Kingdom and New York, NY, USA, pp. 3−32, doi:10.1017/9781009157896.001.
IPCC, 2023: Summary for Policymakers. In: Climate Change 2023: Synthesis Report. Contribution of Working Groups I, II and III to the Sixth Assessment Report of the Intergovernmental Panel on Climate Change [Core Writing Team, H. Lee and J. Romero (eds.)]. IPCC, Geneva, Switzerland, pp. 1-34, doi: 10.59327/IPCC/AR6-9789291691647.001
USGCRP, 2017: Climate Science Special Report: Fourth National Climate Assessment, Volume I [Wuebbles, D.J., D.W. Fahey, K.A. Hibbard, D.J. Dokken, B.C. Stewart, and T.K. Maycock (eds.)]. U.S. Global Change Research Program, Washington, DC, USA, 470 pp., doi: 10.7930/J0J964J6.