El Niño and La Niña: Frequently asked questions
What are El Niño and La Niña?
El Niño and La Niña are opposite phases of a natural climate pattern across the tropical Pacific Ocean that swings back and forth every 3-7 years on average. Together, they are called ENSO (pronounced “en-so”), which is short for El Niño-Southern Oscillation.
The ENSO pattern in the tropical Pacific can be in one of three states: El Niño, Neutral, or La Niña. El Niño (the warm phase) and La Niña (the cool phase) lead to significant differences from the average ocean temperatures, winds, surface pressure, and rainfall across parts of the tropical Pacific. Neutral indicates that conditions are near their long-term average.
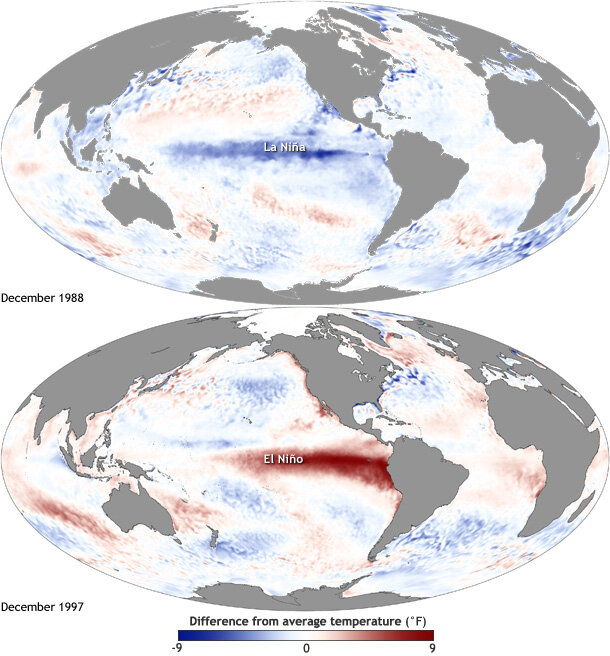
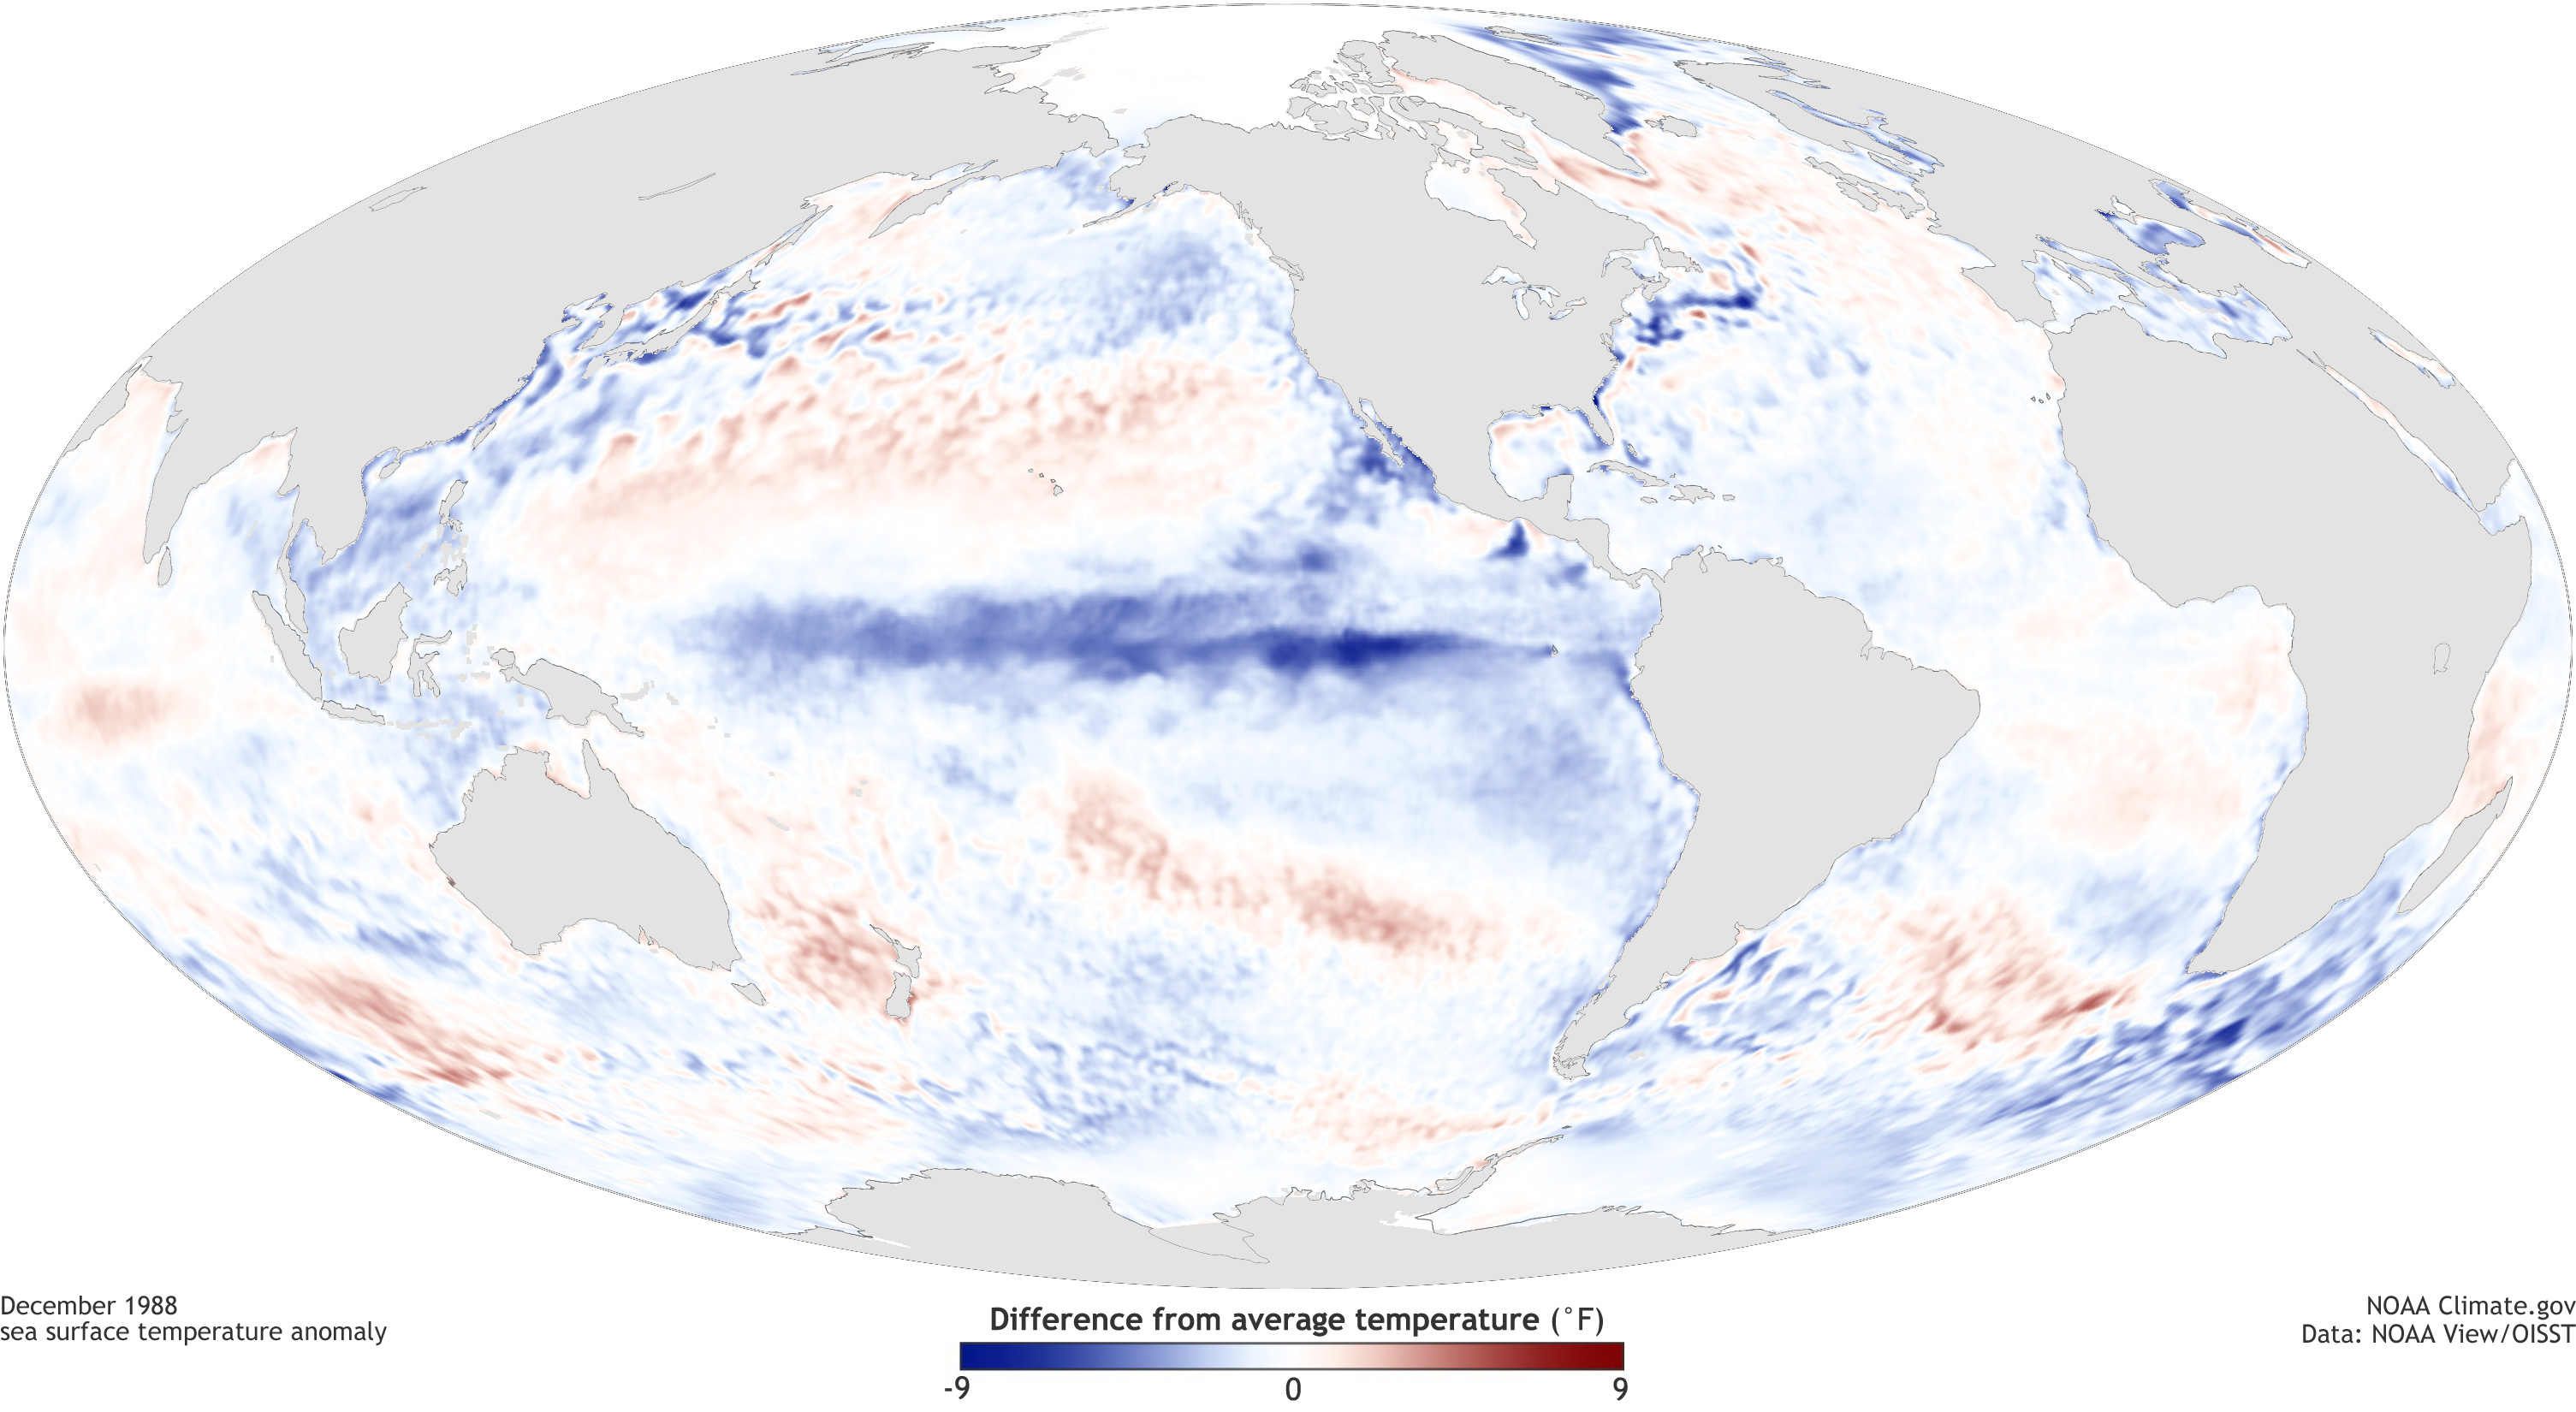
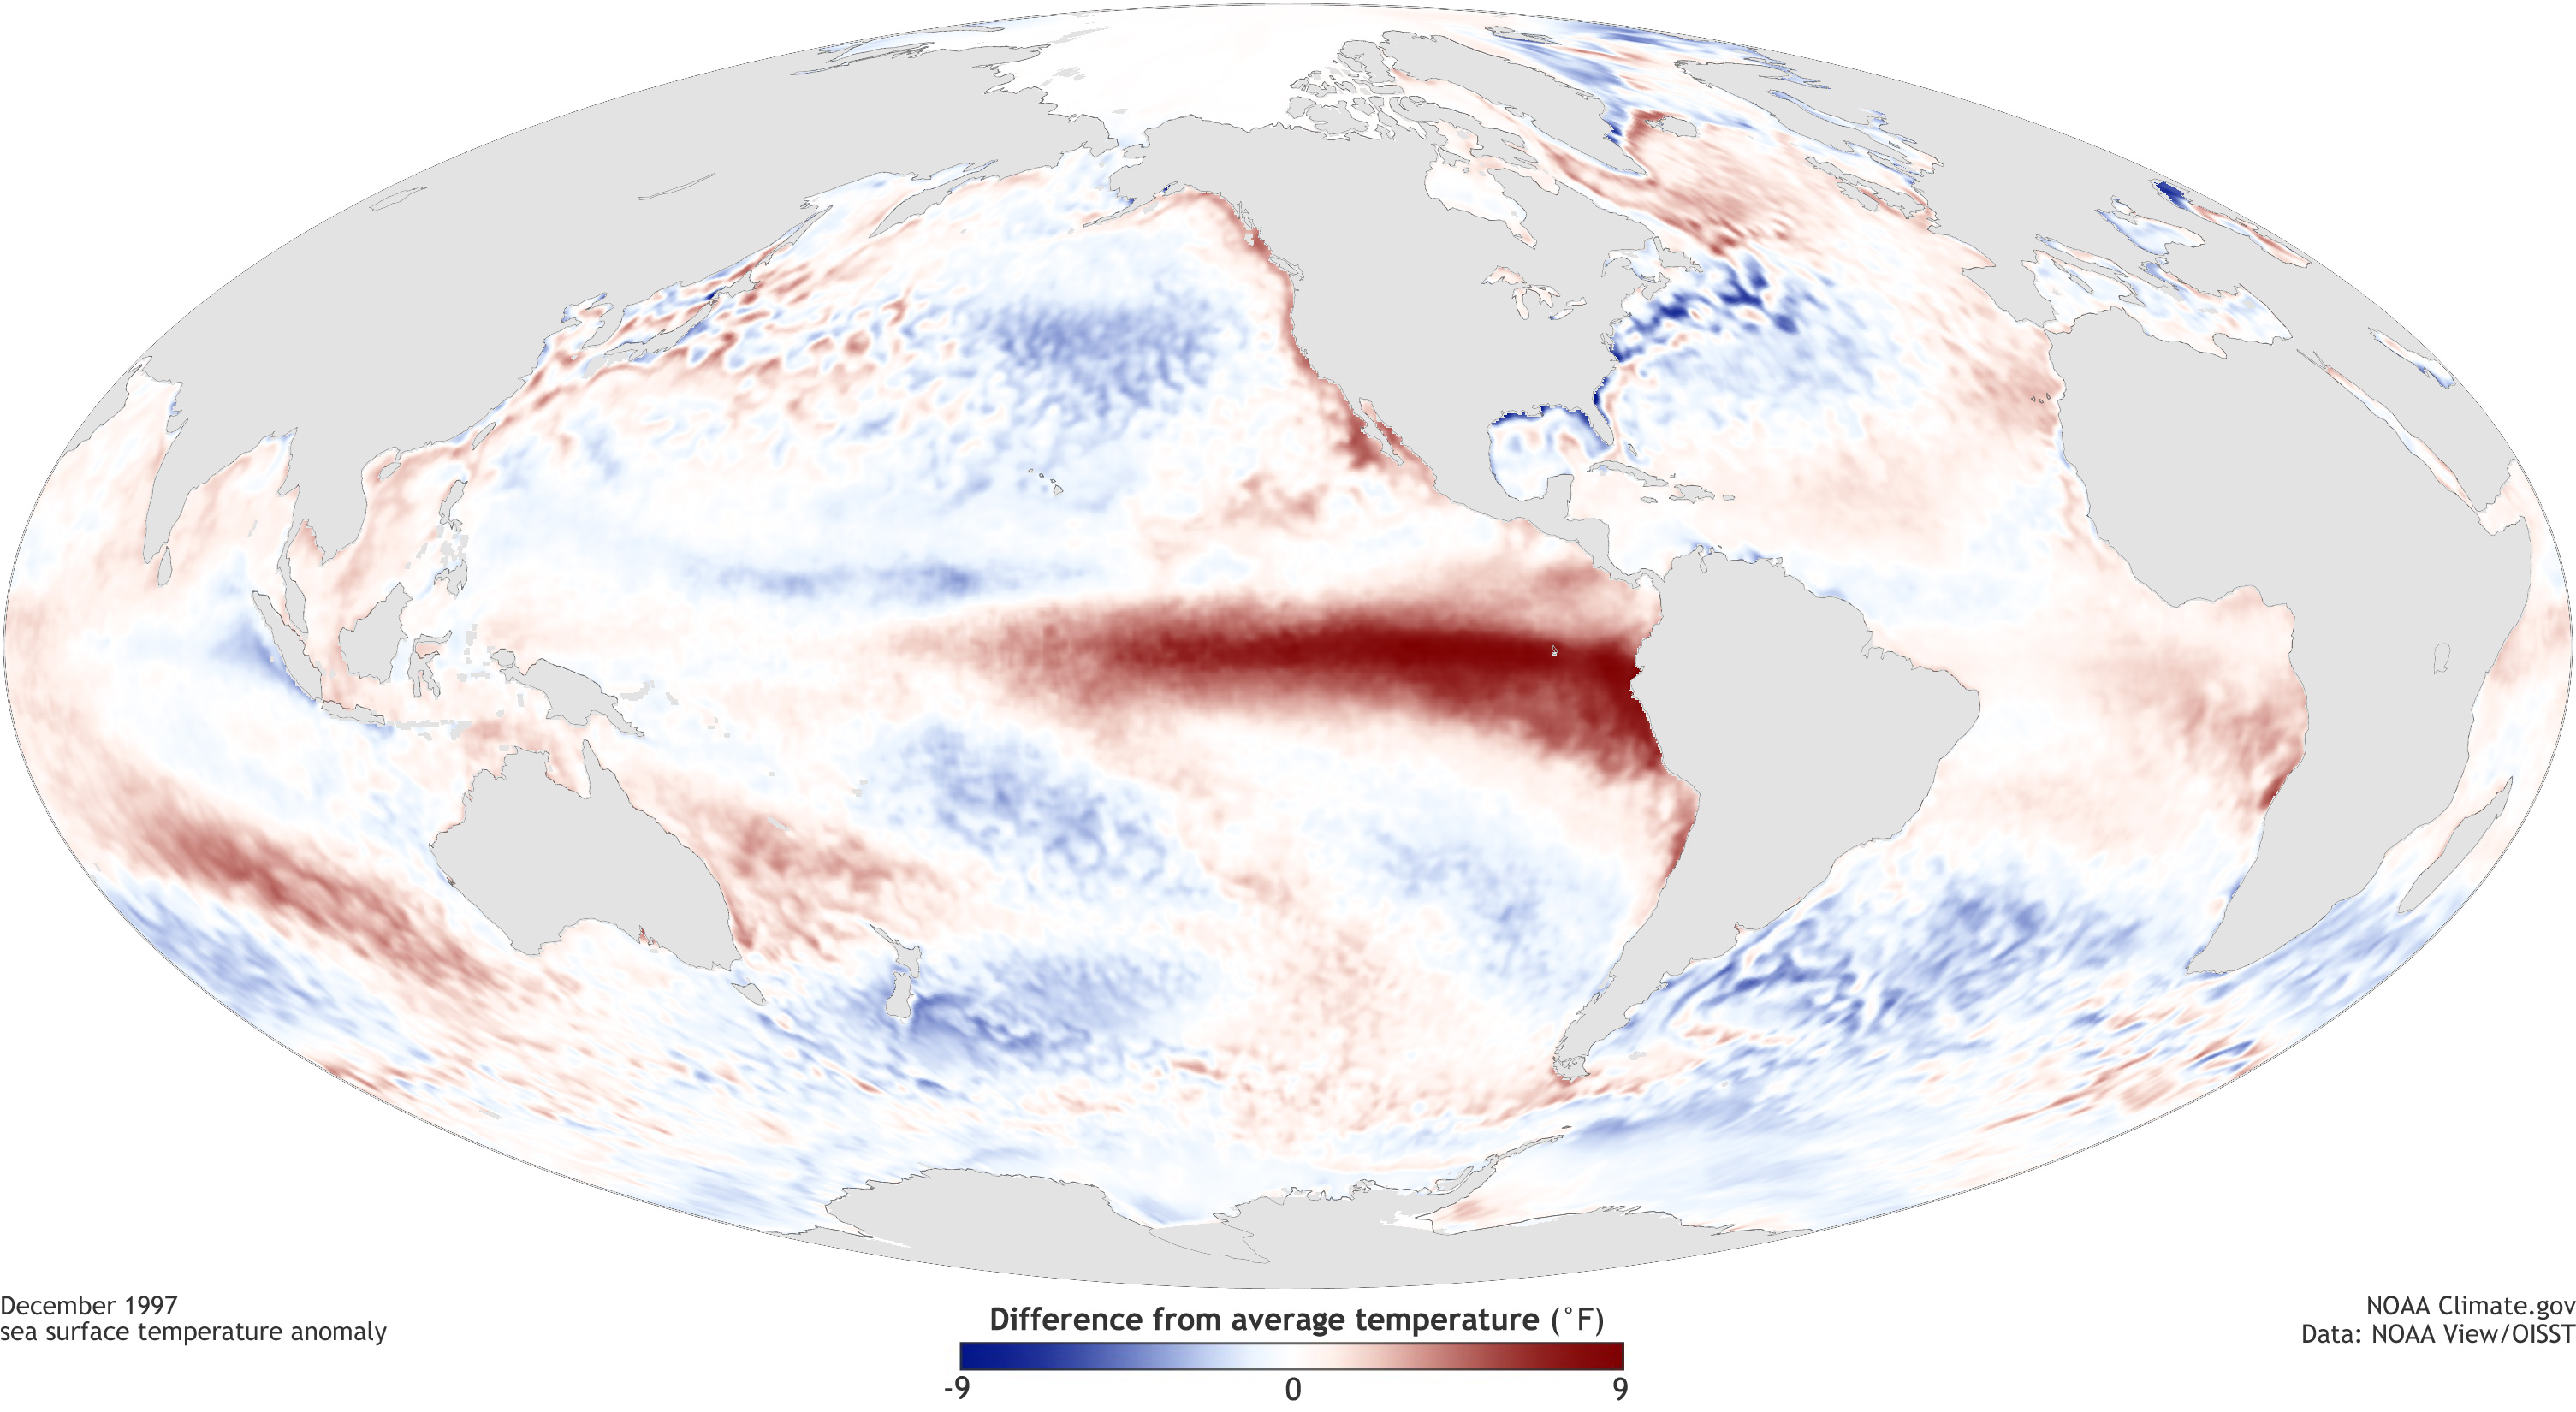
Maps of sea surface temperature anomaly in the Pacific Ocean during a strong La Niña (top, December 1988) and El Niño (bottom, December 1997). Maps by NOAA Climate.gov, based on data provided by NOAA View. large versions La Niña | El Niño
What happens during El Niño and La Niña?
During El Niño, the surface winds across the entire tropical Pacific are weaker than usual. Ocean temperatures in the central and eastern tropical Pacific Ocean are warmer than average, and rainfall is below average over Indonesia and above average over the central or eastern Pacific.
Rising air motion (which is linked to storms and rainfall) increases over the central or eastern Pacific, and surface pressure there tends to be lower than average. Meanwhile, an increase in sinking air motion over Indonesia leads to higher surface pressure and dryness.
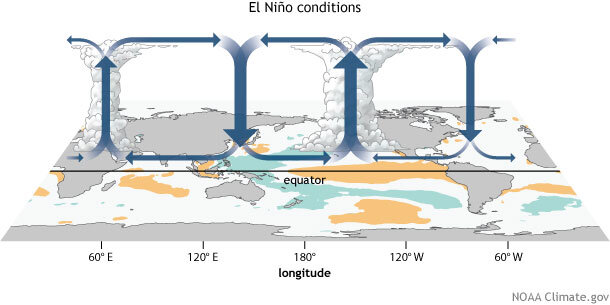
Generalized Walker Circulation (December-February) anomaly during El Niño events, overlaid on map of average sea surface temperature anomalies. Anomalous ocean warming in the central and eastern Pacific (orange) help to shift a rising branch of the Walker Circulation to east of 180°, while sinking branches shift to over the Maritime continent and northern South America. NOAA Climate.gov drawing by Fiona Martin.
During La Niña, it’s the opposite. The surface winds across the entire tropical Pacific are stronger than usual, and most of the tropical Pacific Ocean is cooler than average. Rainfall increases over Indonesia (where waters remain warm) and decreases over the central tropical Pacific (which is cool). Over Indonesia, there is more rising air motion and lower surface pressure. There is more sinking air motion over the cooler waters of the central and eastern Pacific.
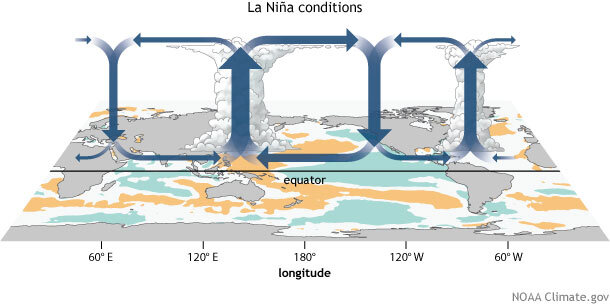
Generalized Walker Circulation (December-February) anomaly during La Niña events, overlaid on map of average sea surface temperature anomalies. Anomalous ocean cooling (blue-green) in the central and eastern Pacific Ocean and warming over the western Pacific Ocean enhance the rising branch of the Walker circulation over the Maritime Continent and the sinking branch over the eastern Pacific Ocean. Enhanced rising motion is also observed over northern South America, while anomalous sinking motion is found over eastern Africa. NOAA Climate.gov drawing by Fiona Martin.
Between the warm phase (El Niño) and cool phase (La Niña), scientists describe conditions as “ENSO-neutral.” Neutral means that the temperatures, winds, convection (rising air), and rainfall across the tropical Pacific are near their long-term averages.
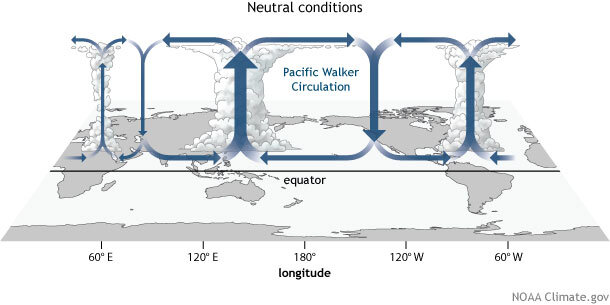
Generalized Walker Circulation (December-February) during ENSO-neutral conditions. Convection associated with rising branches of the Walker Circulation is found over the Maritime continent, northern South America, and eastern Africa. NOAA Climate.gov drawing by Fiona Martin.
Is El Niño a kind of storm that will hit the U.S.?
No, El Niño isn’t a storm that will hit a specific area at a specific time. Instead, the warmer tropical Pacific waters cause changes to the global atmospheric circulation, resulting in a wide range of changes to global weather. Think of how a big construction project across town can change the flow of traffic near your house, with people being re-routed, side roads taking more traffic, and normal exits and on-ramps closed. Different neighborhoods will be affected most at different times of the day. You would feel the effects of the construction project through its changes to normal patterns, but you wouldn’t expect the construction project to "hit" your house.
Was that big storm we just had due to El Niño?
That isn't an answerable question. El Niño does increase the chances for a wet and stormy winter and early spring overall across the southern tier of the United States, but it's impossible to say that any single storm was solely caused by El Niño and wouldn't have happened otherwise.
Think of it this way: Suppose that in an average year, your state experiences 10 winter storms. During this El Niño winter, perhaps you get 13. It's impossible to say which 10 were your "normal" ones and which 3 were the "extra" ones.
However, for any specific storm, scientists can try to estimate if and how much El Niño contributed to making the event especially extreme, for example, by increasing the amount of water vapor available “in the background,” or by shifting the position or strength of the jet stream.
This sort of analysis is called an attribution study. It requires comprehensive observations—both current and historical—as well as highly detailed climate recreations of the weather patterns that gave rise to the storm. It may take scientists several months to conduct this kind of analysis.
How do El Niño and La Niña affect weather patterns?
El Niño and La Niña alternately warm and cool large areas of the tropical Pacific—the world’s largest ocean—which significantly influences where and how much it rains there. The primary location of moist, rising air (over the basin’s warmest water) is centered over the central or eastern Pacific during El Niño and over Indonesia and the western Pacific during La Niña.
This shift disrupts the atmospheric circulation patterns that connect the tropics with the middle latitudes, which in turn modifies the mid-latitude jet streams. By modifying the jet streams, ENSO can affect temperature and precipitation across the United States and other parts of the world. The influence on the U.S. is strongest during the winter (January-March), but it lingers into the early spring.
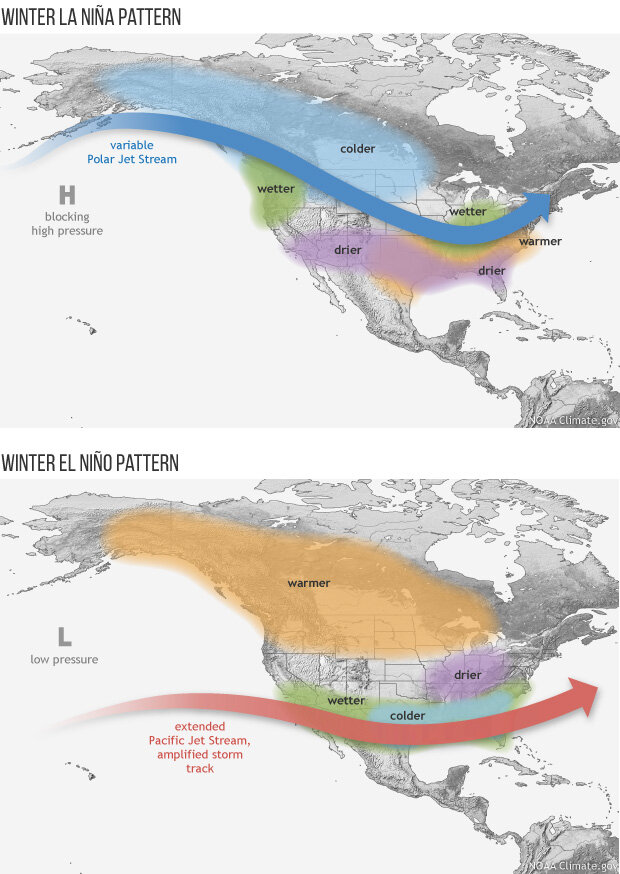
These maps illustrate the typical impacts of El Niño and La Niña on U.S. winter weather. Typical means "common," but not guaranteed because each event is unique. NOAA Climate.gov drawings, adapted from originals by the Climate Prediction Center.
During El Niño, the southern tier of Alaska and the U.S. Pacific Northwest tend to be warmer than average, whereas the U.S. southern tier of state—from California to the Carolinas—tends to be cooler and wetter than average. During La Niña, these deviations from the average are approximately (but not exactly) reversed.
The influence of El Niño and La Niña in some parts of the United States and the rest of the world can be so strong that they increase the odds of “extreme weather events”—phenomena that rank in the highest or lowest 10% compared to historical observations. (Click to view a historical perspective on El Niño impacts in the U.S.)
However, not all of these influences are negative. For example, because the northern tier of the U.S. tends to be warmer than average during El Niño winters, heating costs there may be appreciably reduced.
How does ENSO affect global average temperature?
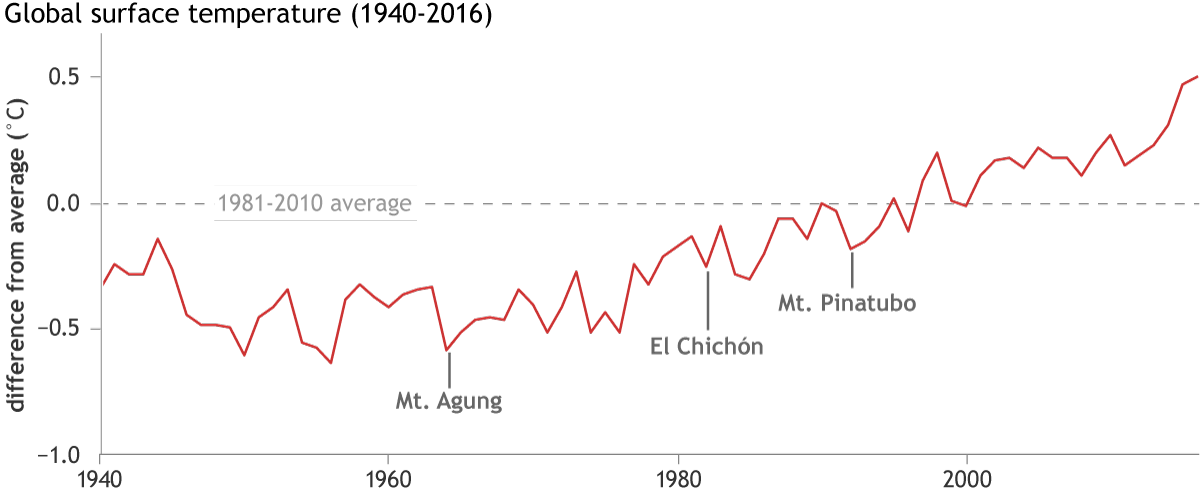
Within any given decade, the warmest years are usually El Niño ones, and the coldest are usually La Niña ones. That’s because the Pacific Ocean is a big place. If you walked around the planet along the equator, you’d be spending over 40% of your time attempting to walk on the water in the Pacific Ocean. This vast size means that warming or cooling in the Pacific due to El Niño and La Niña can leave an imprint on the global average surface temperature.
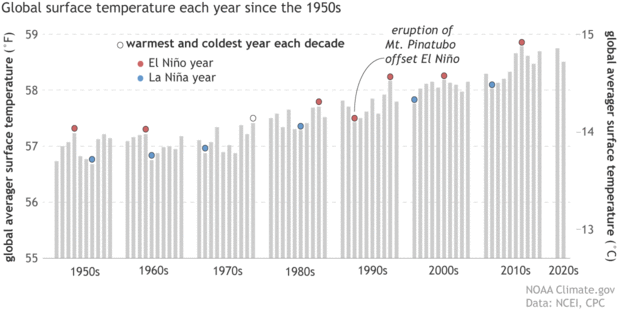
In general, the warmest year of any decade will be an El Niño year, the coldest a La Niña one. This graph shows annual average surface temperatures (gray bars), grouped by decade, from 1950 to 2021. The warmest and coldest years of each decade are topped with circles: red for El Niño-influenced years and blue for La Niña years. We considered a year El Niño or La Niña "influenced" if the December-February was labelled as part of a historical episode by NOAA's Climate Prediction Center or if more than half of the months in that year were. By our definition, 1979 did not qualify as El Niño year because El Niño conditions were present for only 3 months late in the year. 1992 was the coldest year of the 1990s despite being an El Niño year because of the cooling influence of the eruption of Mount Pinatubo in 1991. NOAA Climate.gov graph based on data from NOAA National Centers for Environmental Information.
But the surface warming and cooling during El Niño and La Niña don’t involve more or less heat energy entering or escaping the climate system as a whole. In other words, the whole climate system isn’t really cooling or warming. Heat energy that's already present in the climate system is simply shifting back and forth between the atmosphere (where it shows up in the global surface temperature value) and the deeper layers of the ocean (where it doesn't).
The changes in sea surface temperatures during El Niño and La Niña are caused and helped along by changes in the trade winds, which normally blow from east to west across the tropical Pacific Ocean. When the trade winds are stronger than normal during La Niña, the winds push more surface water to the western half of the Pacific basin. The pool of warm water grows deeper, storing excess heat at depth, and allowing for colder, deeper water to rise to the surface in the eastern half of the Pacific basin.
This wind-driven disturbance creates a large area along the equator where the ocean surface temperatures are below normal. Over the span of months to seasons, heat from the atmosphere then goes into the ocean, leading to cooler air temperatures over a region broad enough to cool down the global average temperature.
During El Niño, when the trade winds are weak or even occasionally reverse themselves, the amount of cold water that comes to the surface is reduced. Warm waters in the west Pacific Ocean slosh to the east. Now there is a large area along the equator where ocean temperatures are above normal. Heat from the ocean then goes out into the atmosphere, leading to warmer air temperatures in the Pacific and subsequently, to warmer global air temperatures (plus a cascade of other impacts).
All of this amounts to a shuffling of heat from one place (ocean) to another (the atmosphere) without affecting the Earth's overall energy budget—the balance between incoming and outgoing energy across the entire planet. So unlike volcanic eruptions, which actually block energy from the Sun from reaching the surface, or solar minimums, which reduce the total amount of energy the Sun emits, the phases of ENSO are not creating or removing energy from the climate system. La Niña hides some of Earth’s existing heat below the surface, while El Niño reveals it. Climate scientists call this kind of re-shuffling internal climate variability.
Will El Niño affect my town/state/region this winter?
Maybe. Probably. Probably not. The answer depends on many factors, including where you live, how strong the event continues to be, and other climate patterns that develop and influence the seasonal outcome.
Scientists have identified a set of typical U.S. impacts that have been associated with past El Niño events. (See How do El Niño and La Niña affect weather patterns?) But “associated with” doesn’t mean that all of these impacts happen during every El Niño episode. They may happen as often as 80 percent of the time, or as infrequently as 40 percent of the time.
In other words, the influence of El Niño on U.S. winter climate is a matter of probability, not certainty. The Climate Prediction Center takes El Niño into consideration in their monthly and seasonal outlooks, which describe the likelihood that temperature and precipitation will be well-above or well- below average.
How does NOAA decide when El Niño is happening?
NOAA uses a 5-category alert system for tracking ENSO that is based on a combination of observed conditions, computer model forecasts, and expert scientific judgment. For El Niño, the eastern tropical Pacific Ocean has to be 0.5°C or more warmer than average, and winds, surface pressure, and rainfall must have begun to show changes consistent with El Niño. (See What happens during El Niño and La Niña?) These changes in average conditions must persist for at least five overlapping three-month periods in order to be count as a full-blown episode in the historical record.
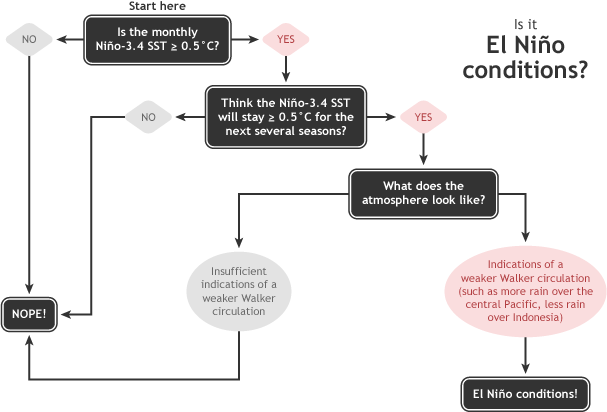
Summary of NOAA decision process in determining El Niño conditions. NOAA Climate.gov drawing by Glen Becker and Fiona Martin.
What causes El Niño and La Niña to occur?
The winds near the surface in the tropical Pacific usually blow from east to west. For reasons scientists don’t yet fully understand, these relatively steady winds sometimes weaken or strengthen for weeks or months in a row.
Weak winds allow warm surface waters to build up in the eastern Pacific. Sometimes, but not always, the atmosphere responds to this warming with increased rising air motion and above-average rainfall in the eastern Pacific. This coordinated change in both ocean temperatures and the atmosphere begins an El Niño event. As the event develops, the warmed waters cause the winds to weaken even further, which can cause the waters to warm even more.
El Niño is often (but not always) followed by La Niña the following year, particularly if the El Niño is strong. During La Niña conditions, the easterly trade winds near the equator get even stronger than they usually are. Stronger winds push surface water into the western Pacific. Meanwhile, cool water from deeper in the ocean rises up in the eastern Pacific. If the cooling persists, it can inhibit rising air movement and rainfall in the eastern Pacific, beginning a La Niña event. As the event develops, the cooled waters cause the winds to strengthen even further, which can cause the waters to cool even more.
How long do El Niño and La Niña typically last?
El Niño and La Niña episodes typically last 9-12 months. They both tend to develop during the spring (March-June), reach peak intensity during the late autumn or winter (November-February), and then weaken during the spring or early summer (March-June).
Both El Niño and La Niña can last more than a year, but it is rare for El Niño events to last longer than a year or so, while it is common for La Niña to last for two years or more. The longest El Nino in the modern record lasted 18 months, while the longest la Niña lasted 33 months. Scientists aren’t sure why the duration of the two types of events can be so different.
Can we predict El Niño and La Niña before they occur?
Yes, scientists can often predict the onset of El Niño and La Niña several months to a year in advance, thanks to modern climate models (such as those used by NOAA’s National Centers for Environmental Prediction) and observation data from the Tropical Pacific Observing System (which includes sensors on satellites, ocean buoys, and radiosondes), which constantly monitors changing conditions in the ocean and atmosphere. Without these tools we wouldn’t be able to detect or predict the onset of El Niño or La Niña.
Why is predicting El Niño and La Niña so important?
El Niño and La Niña can make extreme weather events more likely in certain regions. If we can predict El Niño and La Niña, we can predict a greater chance of the associated extreme events. Better predictions of where and when extreme weather events are likely to happen (e.g., floods and droughts) could save the United States billions of dollars in damage costs.
Predicting the life cycle and strength of El Niño and La Niña is critical for helping people plan for, avoid, or mitigate potential damages in every sector of society, including agriculture, fisheries, energy, water, transportation, and health care). Advances in scientists’ ability to predict future ENSO states could significantly improve U.S. economic opportunities in these vital sectors.
Can we prevent El Niño and La Niña from occurring?
No, El Niño and La Niña are naturally occurring climate patterns and humans have no direct ability to influence their onset, intensity, or duration.
Does global warming affect El Niño and La Niña?
There are many ways in which global warming could affect the frequency and intensity of El Niño / La Niña (see this ENSO blog post, for example), but scientists currently have low confidence in their ability to predict exactly how a warmer world affect the ENSO. Scientists have high confidence, however, that ENSO itself has been occurring for thousands of years, and will continue into the future. Global warming is likely to affect the impacts related to El Niño and La Niña, including extreme weather events.
Do El Niño and La Niña influence the Atlantic and Pacific hurricane seasons?
Yes, the continental United States and Caribbean Islands have a substantially decreased chance of experiencing a hurricane during El Niño and an increased chance of experiencing a hurricane during La Niña.
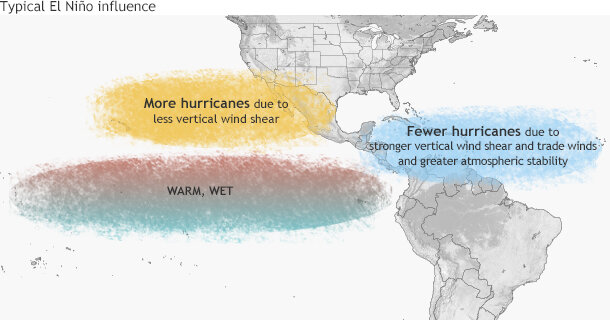
Typical influence of El Niño on Pacific and Atlantic seasonal hurricane activity. Map by NOAA Climate.gov, based on originals by Gerry Bell.
Both El Niño and La Niña influence where Atlantic hurricanes tend to form. During El Niño, fewer hurricanes develop in the deep tropics from African easterly waves. Conversely, during La Niña, more hurricanes form in the deep tropics from African easterly waves and, therefore, have a greater likelihood of becoming major hurricanes that may eventually threaten the Caribbean Islands and the United States.
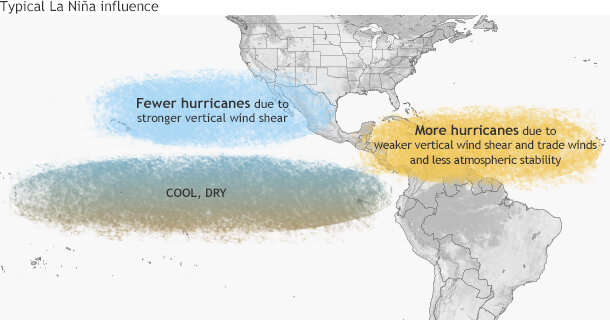
Typical influence of La Niña on Pacific and Atlantic seasonal hurricane activity. Map by NOAA Climate.gov, based on originals by Gerry Bell.
Overall, El Niño contributes to more eastern and central Pacific hurricanes and fewer Atlantic hurricanes while, conversely, La Niña contributes to fewer eastern and central Pacific hurricanes and more Atlantic hurricanes..
Do El Niño and La Niña influence tornado activity in the U.S.?
Yes, El Niño and La Niña appear to have an effect on tornado activity. Since a strong jet stream is an important ingredient for severe weather, the position of the jet stream helps to determine the regions more likely to experience tornadoes.
The jet stream over the United States is typically considerably different during El Niño winters as compared to La Niña winters. During El Niño, the jet stream is oriented from west to east across the southern portion of the United States. Thus, this region becomes more susceptible to severe weather outbreaks during the winter. Conversely, during La Niña, the jet stream and severe weather are likely to be farther north.
Why are these climate patterns called “El Niño” and “La Niña”?
Centuries before it was a focus of scientific study, South American fishermen noticed warmer-than-normal coastal Pacific Ocean waters and dramatic decreases in fish catch occurring periodically around Christmas time. They nicknamed the phenomenon “El Niño” (Spanish for little boy) in connection with the celebration of the Christian holiday marking the birth of Jesus. In the 1980s, when the opposite phase of El Niño was discovered (i.e., cooler-than-normal ocean temperatures), scientists called it “La Niña” (Spanish for little girl).
Where can I find more information about El Niño and La Niña?
NOAA’s primary point-of-entry for online information about ENSO is available at http://www.climate.gov/enso.
NOAA Climate.gov publishes a frequently updated “ENSO blog,” written by climate scientists in language easy to understand by non-scientists.
ENSO forecasts, outlooks, and diagnostic discussion information is available from NOAA’s Climate Prediction Center, at: http://www.cpc.ncep.noaa.gov.
Maps showing El Niño and La Niña historical impacts on weather patterns in the United States are available from NOAA’s National Center for Environmental Information (here) and NOAA’s Earth System Research Laboratory (here).
Older ENSO FAQs from other NOAA labs and centers
The El Niño FAQ from AOML
El Niño FAQ from PMEL
El Niño and La Niña FAQs from CPC
FAQs about El Niño and the western U.S., Alaska, and Hawaii
ENSO FAQ from ESRL