Global climate summary for January 2024
Highlights
-
Temperatures were above average over much of the globe, but the eastern United States, most of Europe and a few other areas were cooler than average.
-
There is a 22% chance that 2024 will be the warmest year in NOAA’s 175-year record and a 79% chance that El Niño will transition to neutral conditions by mid-year.
-
Northern Hemisphere snow cover was near average, but Antarctic sea ice extent was fifth lowest on record for January.
-
Global precipitation was nearly record-high in January, following on the heels of a record-wet December.
Temperature
The January global surface temperature was 2.29°F (1.27°C) above the 20th-century average of 54.0°F (12.2°C), making it the warmest January on record. This was 0.07°F (0.04°C) above the previous record from January 2016. According to NCEI’s Global Annual Temperature Outlook, there is a 22% chance that 2024 will rank as the warmest year on record and a 99% chance that it will rank in the top five.
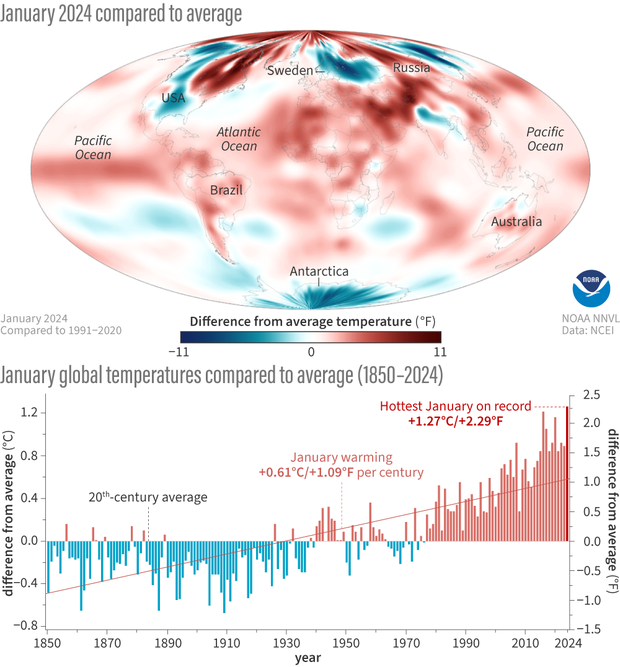
(map) Global surface temperatures for January 2024 compared to the 1991-2020 average, showing a few colder-than-average locations (blue) scattered among mostly warmer-than-average temperatures (red). (graph) January temperatures each year from 1850-2024 compared to the 20th-century average. It's been several decades since we've had a January that was colder than average (blue bars, below the zero line). January 2024 (final red bar) was the warmest January on record. Januarys are getting warmer at a rate of 1.09 ˚F (0.61 ˚C) per century. NOAA Climate.gov images, based on data from NOAA National Centers for Environmental Information (NCEI).
January saw a record-high monthly global ocean surface temperature for the 10th consecutive month. El Niño conditions that emerged in June 2023 continued into January, but according to NOAA's Climate Prediction Center it is likely that El Niño will transition to ENSO-neutral by April–June 2024 (79% chance), with increasing odds of La Niña developing in June–August 2024 (55% chance).
Temperatures were above average throughout the Arctic, most of northeastern North America, central Russia, southern and western Asia, Africa, South America, eastern and southeastern Asia and Australia. Much of northwestern North America, the central and southern United States, northern and eastern Europe, northeastern Asia and Antarctica experienced near-to- cooler-than-average temperatures during January. Sea surface temperatures were above average across much of the northern, western and equatorial Pacific Ocean, as well as parts of the western Indian Oceans.
Precipitation
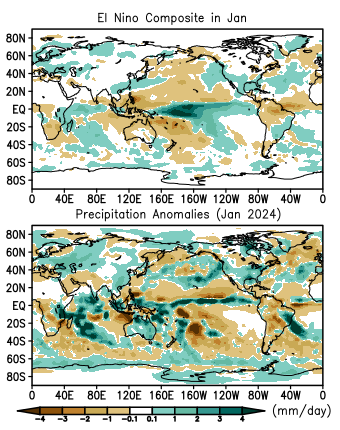
- The El Niño rainfall anomaly pattern over the central and western Pacific Ocean and Maritime Continent has weakened.
- Further afield the patterns over the Indian Ocean, Africa and the southern U.S. are more clearly El Niño-like.
- Overall the pattern correlation between this January’s rainfall anomaly pattern and the El Niño composite plummeted from a high of +0.59 last month to only +0.19.
- Global total precipitation for this January is nearly a record high following December’s record high for that month of the year.
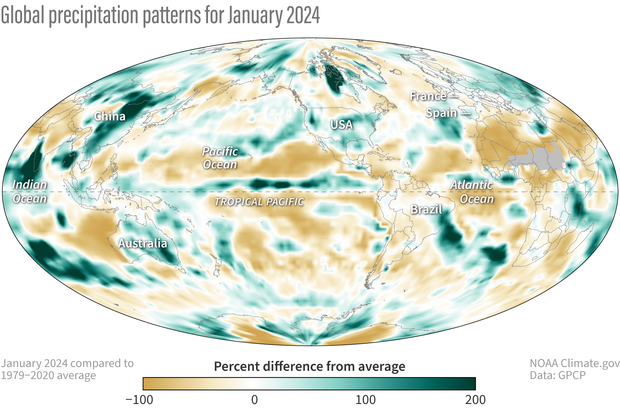
Percent difference from long-term average (1979-present) precipitation in January 2024. Places that were drier than average are brown; places that were wetter than average are green. NOAA Climate.gov map, based on data provided by the Global Precipitation Climatology Project.
The current El Niño continues through January, but the departures from average on the global map show a mixed pattern, with some rainfall excess/deficit features typical of El Niño situations and others differing from the expected pattern. In the central and eastern Pacific along the Intertropical Convergence Zone, there is still a narrow, strong positive anomaly as typical of El Niño, with a rainfall deficit just to the north and south. But just to the west the wide positive feature expected at ~180° longitude at the Equator is weak this month, despite the Niño 3.4 Index being +1.9, easily within strong El Niño range. [The "Niño 3.4 Index" tracks sea surface temperatures in the central-eastern tropical Pacific Ocean: the key ENSO monitoring region].
The match between this January and the El Niño composite becomes even more fraught over the Maritime Continent to the west where generally very dry conditions are typical of El Niño, but rainfall is in excess over Borneo and Malaysia, although deficit features exist over some surrounding areas, especially between Sumatra and Australia. Australia itself is typically very dry during El Niños, but for this January it is mostly wetter than normal across the continent, and there was even flooding first in Victoria and then heavy rains in northern and northeastern parts of the country later in the month.
Northern South America is mostly dry, as is typical of El Niño, but the rest of the pattern does not match well. The spatial correlation of January’s anomaly pattern with the El Niño composite has plummeted to +0.19 from a high of +0.59 in December, seemingly indicating a weakening of El Niño at core tropical locations. It will be interesting to see if that type of change continues next month, or if this is a temporary change. Models are predicting an end to the El Niño over the next few months. [Read more about what we can expect from the El Niño-Southern Oscillation this spring in Climate.gov's latest ENSO Blog post.]
For a deeper dive on January 2024 climate, including circulation patterns, major events, and separate statistics and rankings for Earth's land and ocean areas, see the full January 2024 monthly report from NOAA NCEI.