October 2021 was ninth-wettest, sixth-warmest on record for U.S.
Precipitation was the star of the show across the contiguous United States in October 2021, according to the latest monthly climate summary by NOAA’s National Centers for Environmental Information. Much of the country received more than 100 percent of their average precipitation, and in many states, precipitation totals were much higher than average. Overall, the month ranked ninth-wettest October in the historical record.
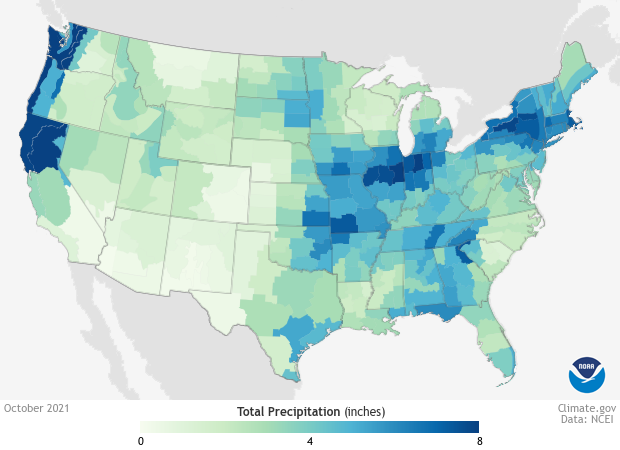
Total precipitation across the contiguous United States in October 2021. Places that received little to no precipitation are pale green; places that received 8 or more inches of precipitation are dark blue. Map by Climate.gov, based on data from NOAA's National Centers for Environmental Information.
On the West Coast, much of the above-average precipitation came in the form of atmospheric rivers—temporary, well-defined bands of water vapor that stretch like a river from the tropics or subtropics to higher latitudes and which are pushed along by strong winds. At least one of the events, taking place on October 24, was ranked as a “Category 5” event by researchers at the Western Weather and Water Extremes group at Scripps Institution. Parts of the state set a new record for wettest 24-hour period. Meanwhile, the East Coast was battered by a Nor’easter that generated heavy rain, flash flooding, and power outages in the coastal Mid-Atlantic.
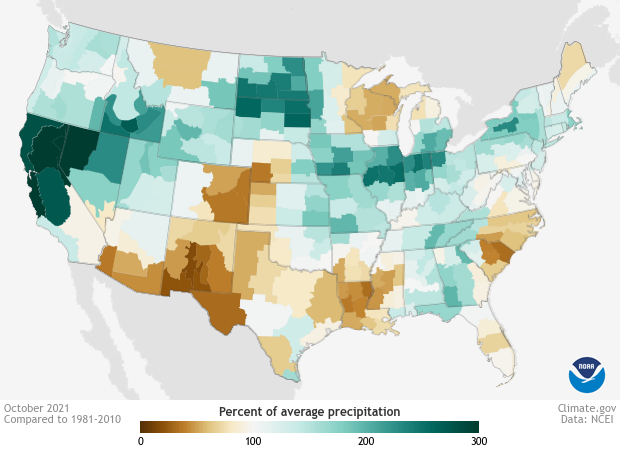
Precipitation across the Lower 48 in October 2021 as a percent of average. Places that received less than 100 percent of their average October precipitation are brown; places that received more than 100 percent of their average precipitation are blue-green. Map by Climate.gov, based on data from NOAA's National Centers for Environmental Information.
The soaking of multiple Western states—California, Oregon, Washington, Nevada, Idaho, and Wyoming—provided some relief in the intensity of the long-lasting drought that has parched the region over the past year. Still, nearly half the contiguous United States was in some level of drought at the start of November, and it intensified in locations that were missed by the month’s generous precipitation, including parts of Texas, eastern Colorado, Michigan, and the Carolinas.
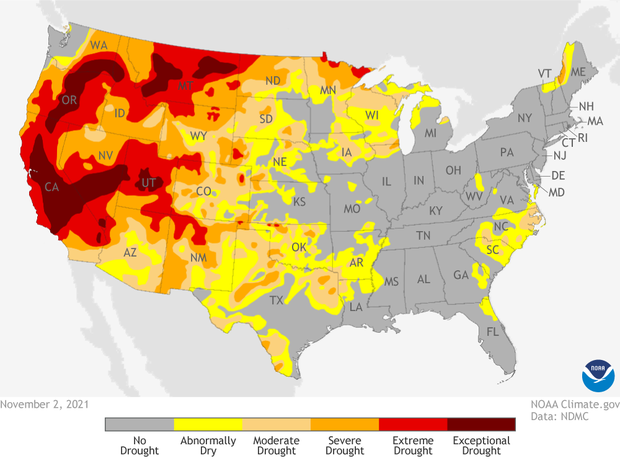
Drought conditions across the Lower 48 as of November 2, 2021. Despite generous October rainfall, many states in the West remained in a state of extreme to exceptional drought. NOAA Climate.gov, based on data from the U.S. Drought Monitor project.
According to NCEI, the average temperature across the Lower 48 was the sixth-warmest on record, 2.9 degrees Fahrenheit (1.6 degrees Celsius) warmer than the 20th-century October average of 57.0 degrees. The warmth was widespread, stretching from the Rockies all the way to the East Coast. However, October was cooler than average for the West Coast part of the Southwest.
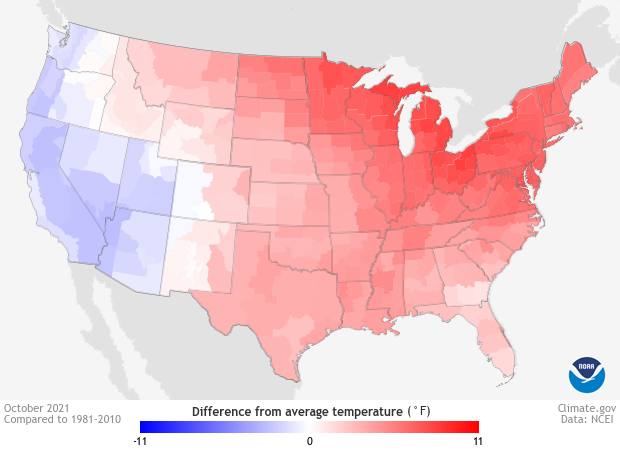
Temperature across the contiguous United States in October 2021 compared to the 1981-2010 average. Places that were warmer than average are red; places that were cooler than average are blue. NOAA Climate.gov map based on data from NOAA's National Centers for Environmental Information.
For more details on the U.S. climate in October, see NCEI’s State of the Climate report. For more information on drought conditions, visit Drought.gov.