Top 10 Global Climate & Weather Events of 2011
Year in Review
According to NOAA scientists, 2011 was a record-breaking year for climate extremes, not just in the United States, but around the world. A terrible drought contributed to famine in the Horn of Africa, and torrential rains lead to deadly floods in Colombia, Thailand, and the Philippines.
As part of its annual review of Earth‘s climate, NOAA scientists and other experts from around the world identified and ranked the year‘s most significant global climate or weather events.
The voters consider factors such as the scope and unusualness of the event, its immediate human and economic impact, and whether it is emblematic of climate trends or variability.
These images showcase the events that will go down in NOAA‘s record books as 2011‘s most significant climate or weather events.
#1 East Africa Drought, throughout 2011
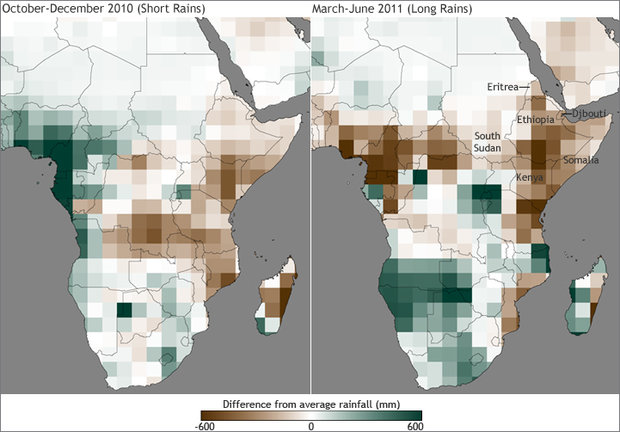
The drought in the Horn of Africa including Somalia, Ethiopia, Eritrea, Kenya, and Djibouti was one of the worst in decades, affecting an estimated 10-11 million people. Famine was declared in parts of Somalia for first time since 1992. The color-coded map above (original post) shows difference from average rainfall (green is wetter than average, brown is drier than average) during the two rainy seasons leading up to the 2011 drought. More information: NCDC July Global Hazards Report.
#2 Flooding in Thailand, July-October
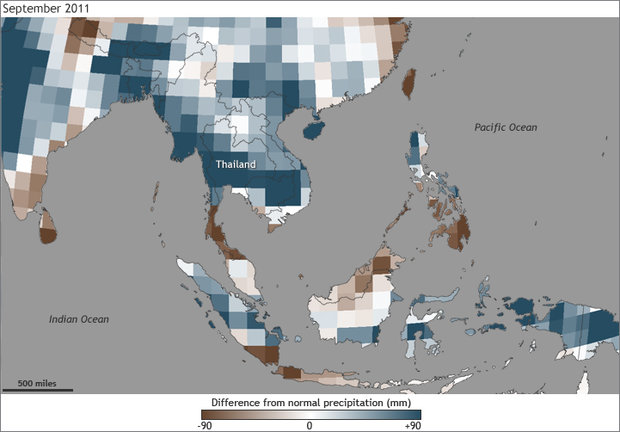
Thailand had its worst flooding since 1942, affecting 9 million people. Floodwaters made their way from north to south, eventually reaching Bangkok. The map above shows difference from average rainfall in September 2011 (blue is wetter than average, brown is drier than average), based on data from NOAA’s Earth System Research Laboratory. More information: October Global Hazards Report.
#3 Eastern Australia Floods, December 2010-February 2011
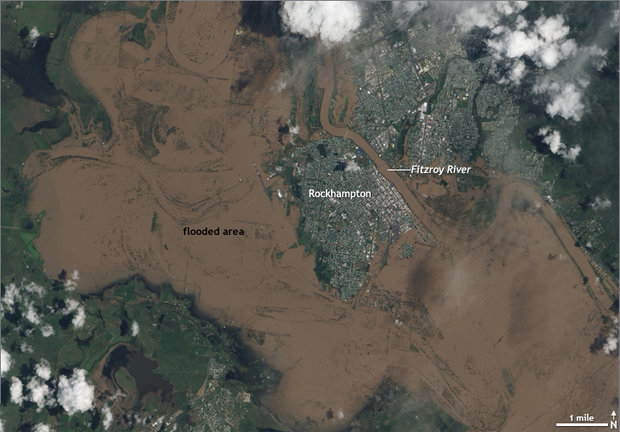
Frequent and persistent heavy rain led to severe flooding across eastern Australia. The flooding was among the most significant in Australia’s recorded history. This NASA satellite photo from January 9 shows the result of heavy rains along the Queensland coast: the city of Rockhampton was cut off from the rest of the country by a sea of floodwater (brown areas) from the overflowing Fitzroy River. More information: January Global Hazards Report.
#4 Double-dip La Niña, throughout 2011
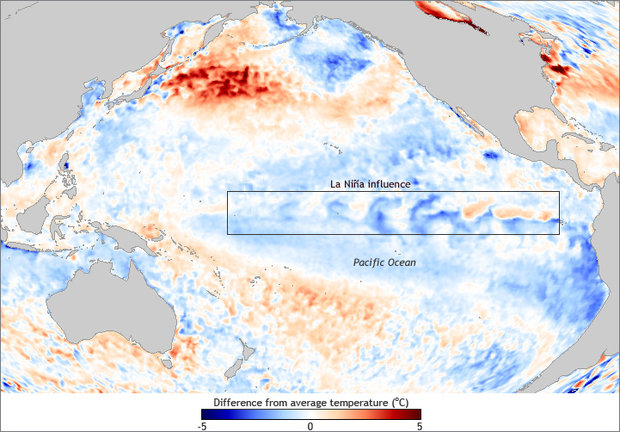
The year began in the midst of a relatively strong and lasting La Niña, which weakened into neutral state by mid-year. However, by year‘s end, La Niña had re-established itself: eastern Pacific tropical temperatures were cooler than average. Many climate outcomes in 2011 were consistent with those expected during La Niña. The map above (original post) shows difference from average temperature in the Pacific on September 27. More information: NOAA CPC’s ENSO page.
#5 Flash Floods in Brazil, January 6-12
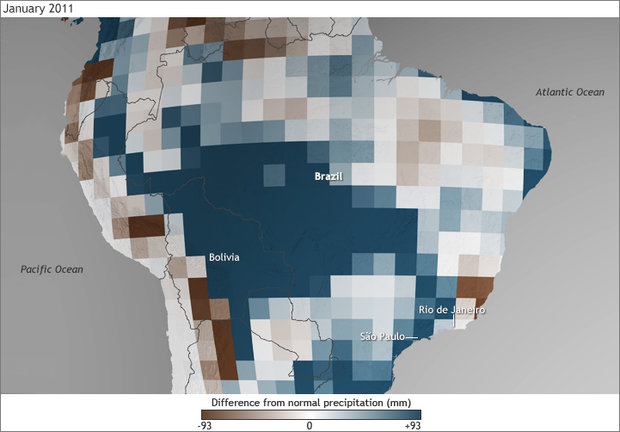
Heavy rainfall caused severe flash floods and landslides across southeastern Brazil. This was one of the worst natural disasters in Brazil’s history. At least 830 people were killed. The map above shows the excessive rainfall in January (blue is wetter than average, brown is drier than average), based on data from NOAA’s Earth System Research Laboratory, overlaid on topography. Some of the worst flash flooding occurred in the hilly terrain north of Rio de Janerio and São Paulo. More information: January Global Hazards Report.
#6 Tropical Storm Washi (Sendong), December 16-17
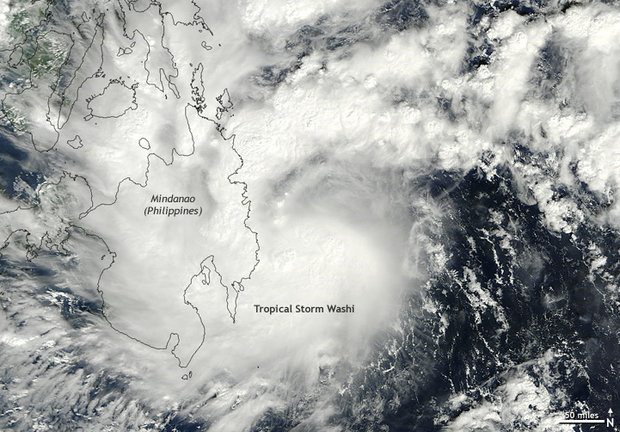
Tropical Storm Washi struck the southern Philippine island of Mindanao and killed at least 1,250 people. Initial damages were estimated at nearly $23 million U.S. dollars. Between 1978 and 2010, only 15 tropical cyclones occurred in this (Western Pacific) basin during December and only two made landfall. The NASA satellite image above shows Washi on December 16. More information: Western North Pacific Tropical Storms.
#7 Arctic Sea Ice Minimum, September 9
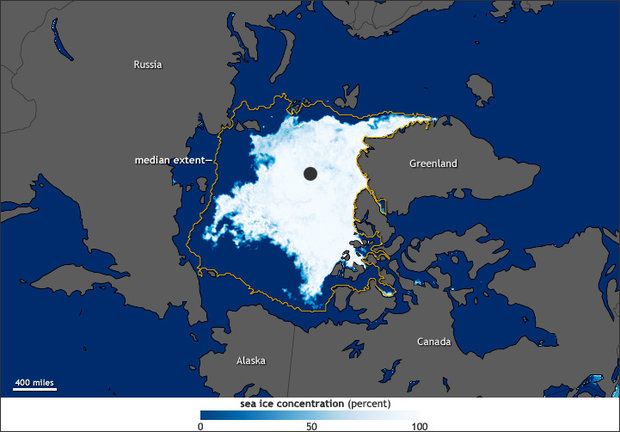
The 2011 summer minimum sea ice extent was 4.33 million square kilometers: the second smallest (following 2007) of the satellite era. The five smallest Arctic ice extents have occurred in the past five years (2007-2011). The September Arctic sea ice volume (which incorporates extent and thickness) was the smallest on record. The NASA image above shows sea ice concentration on September 9. More information: September Global Snow & Ice Report.
#8 Rain & Floods in Colombia, March-May
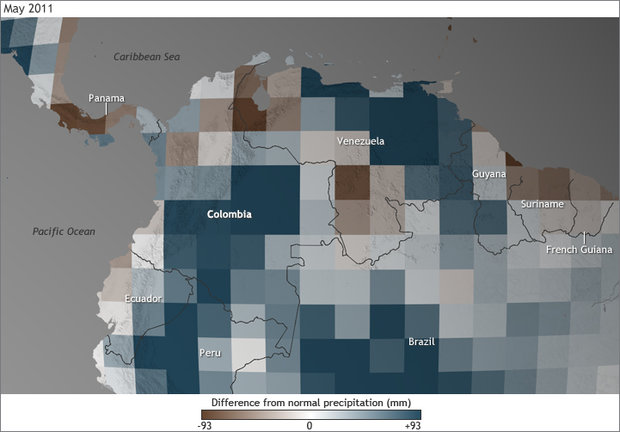
Unusually heavy rains killed at least 425 people across Colombia and caused billions of dollars in damages. Three million people were affected. Colombia received at least 5 times the average rainfall for the season. The map above shows difference from average rainfall in May (data from NOAA’s Earth System Research Laboratory) overlaid on a topographic map that illustrates the country’s steep terrain, which amplified the flood hazard. More information: May Global Hazards Report.
#9 Drought in Mexico, throughout 2011
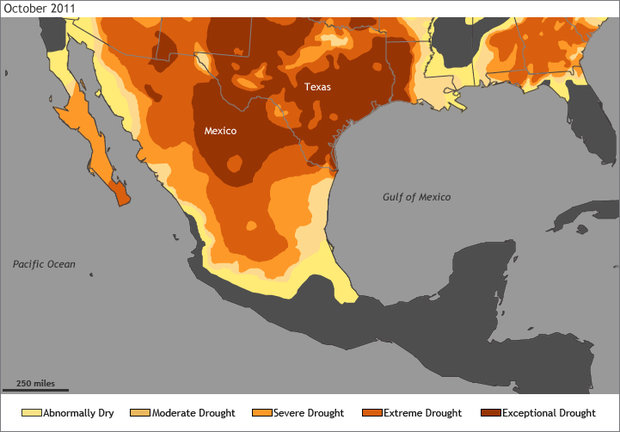
Drought that began in late 2010 worsened throughout 2011, particularly across northern and central Mexico. By late October, more than half the country was in severe to exceptional drought. The event is being considered Mexico's worst drought in 70 years, with an estimated 2.5 million people affected, 2.2 million acres of cropland destroyed, and hundreds of thousands of livestock lost. The map above shows drought classification in October. More information: North American Drought Monitor.
#10 Drought in Europe, September-November
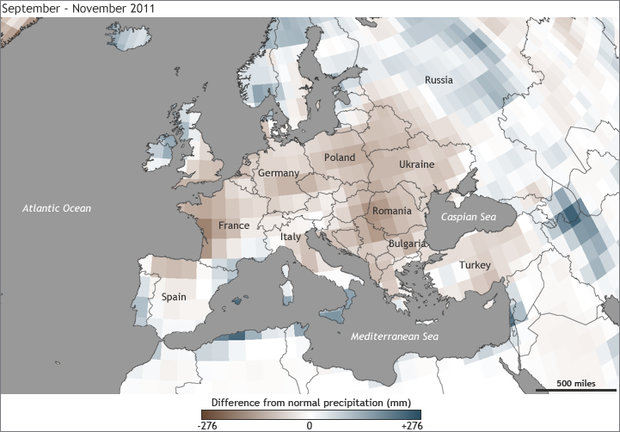
Much of Central and Eastern Europe experienced major drought conditions in autumn. Germany, Austria and the Czech Republic each had their driest November on record. Many locations on the Danube fell to record low levels. In some areas, shipping was forced to a halt due to shallow waters. Unexploded bombs resurfaced in several rivers after being underwater since World War II. The map above shows difference from average rainfall for September through November (blue is wetter than average, brown is drier than average), based on data from NOAA’s Earth System Research Laboratory. More information: November Global Analysis.