U.S. climate outlook for April 2025
After a winter with some notable wintry blasts across large parts of the United States, March provided a nice break for those who prefer warmer weather. Temperatures during March were above normal coast to coast, except for parts of the Southwest and Florida, with anomalies (differences from average) exceeding 5 degrees Fahrenheit across large parts of the middle of the country. It was also drier than average across much of the central and eastern U.S., with significantly wetter-than-normal precipitation observed only in the coastal Pacific Northwest, northern Great Lakes states and extreme southern Texas. As a result, drought coverage also increased, but more on that later. Will the milder weather of March continue across the country? Will April showers be plentiful enough to result in May flowers and, more importantly, drought improvement? Let’s see what NOAA’s Climate Prediction Center (CPC) thinks will occur during April.
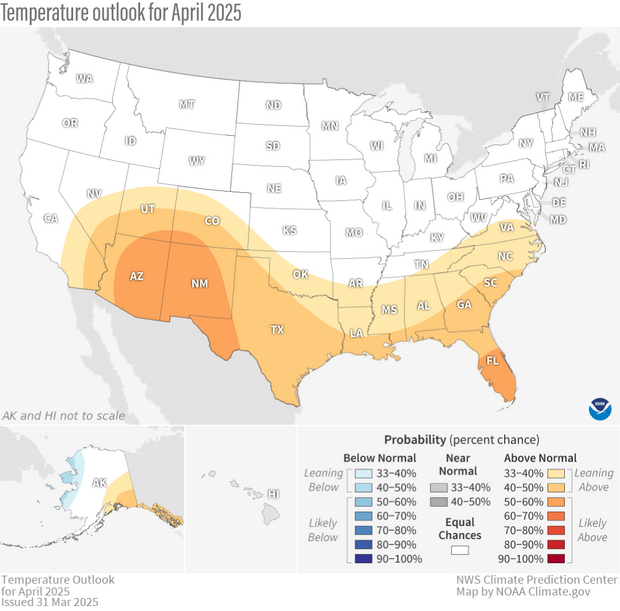
The U.S. temperature outlook for April 2025, showing where the monthly temperature is favored to be much warmer than average (orange and red) or much cooler than average (blues). Darker colors mean higher chances, not more extreme temperatures. White areas mean that there are equal chances for a warm, cool, or near-average April. Much warmer or much cooler than average means "in the upper or lower third" of average April temperatures from 1991-2020. Text-only forecast for Hawaii available from NOAA Climate Prediction Center.
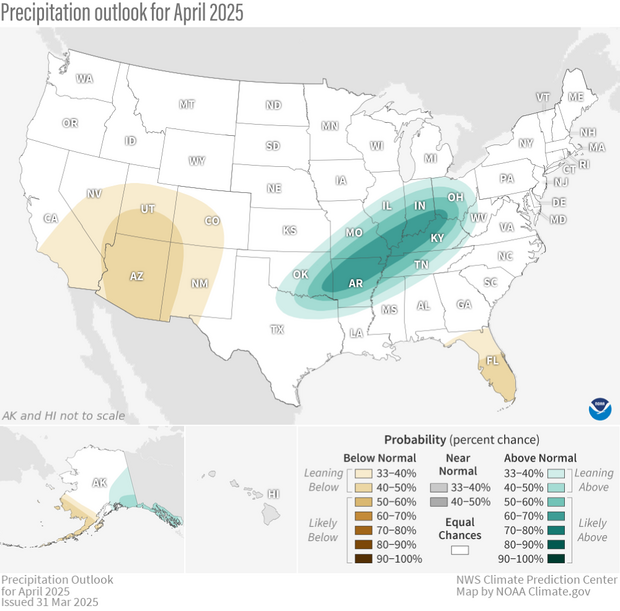
On March 31, CPC released its monthly climate outlooks for temperature, precipitation, and drought across the United States for April 2025. The temperature outlook favors well-above-average temperatures across the southern tier of the country and in southeastern Alaska. Below-average temperatures are favored only in western Alaska, with no tilt in the odds toward any category shown across central and northern parts of the contiguous U.S. The precipitation map also has a fairly large area with “equal chances,” meaning no specific category is more likely than another. Well-above-average precipitation is favored in southeastern Alaska and in a region stretching from Texas into the Ohio Valley. Well-below-average precipitation is most likely for southwestern Alaska, much of the Southwest, and in Florida.
The precipitation outlook for April 2025, showing where the average precipitation (rain and snow) is favored to be much higher than average (greens) or much lower than average (browns). Darker colors mean higher chances, not more extreme precipitation departures. White areas mean that there are equal chances for a wet, dry, or near-average April. Much higher or much lower than average means "in the upper or lower third" of total April precipitation amounts from 1991-2020. Text-only forecast for Hawaii available from NOAA Climate Prediction Center.
Continue reading if you’d like to understand the basis for the outlooks, how drought changed during March, and expectations about drought during April. And remember that the colors on the temperature and precipitation outlook maps provide information about the most likely outcome, but other outcomes are always possible, just less likely. More details about interpreting the outlooks can be found here.
The monthly outlooks were produced considering the Week 1 forecast from the Weather Prediction Center (WPC), and CPC’s own 6-10 day, Week 2, and Week 3-4 outlooks. (Note that all those links point to the most recent versions of those maps. To see the versions that were available at the start of the month, use the “Archives” links on those pages). Other tools that forecasters examined this month included longer-range forecast models such as the Global Ensemble Forecast System (GEFS) and the Climate Forecast System (CFSv2), as well as products derived from these models based on their historical strengths and weaknesses. La Niña is expected to transition to neutral during April, and the Madden-Julian Oscillation (MJO) is currently inactive (and computer models disagree on how it will behave in coming weeks), so neither of those typical climate drivers was considered for these outlooks.
April outlook favors mild temperatures across the South
The April temperature outlook favors well-above-average temperatures across the southern tier of the nation and also in southeastern Alaska and the Alaska Panhandle. (Well above average means “in the warmest third of all Aprils in the 1991-2020 climate record.”) Well-below-average temperatures are only favored in western Alaska, with equal chances (no tilt in the odds toward above, near, or below normal) favored elsewhere. The shorter-term forecasts (i.e., the first 2 weeks of the month) imply a variable pattern, with a warm start to the month in the East followed by much-below-normal temperatures during the second week of April. Similarly, it appears that temperatures will begin the month well below normal in the western part of the nation, with a reversal likely for Week 2. The pattern during the latter parts of the month appears different yet again, with above-average temperatures favored in much of the West, in the Deep South and along the East Coast.
Given the changeable pattern anticipated during the month, probabilities everywhere are fairly modest, with the greatest odds for above-average temperatures located in the Southwest and in southern Florida (50-60%), consistent with the Week 3-4 outlook. Other regions favored to experience a warmer-than-normal April have lesser probabilities of only 33-50%, with the lower probabilities highlighting the uncertainty due to the predicted temperature variability throughout the month.
April precipitation shows a wet month likely in parts of the Ohio and Mississippi Valleys
With upwards of 5 inches of rain predicted to fall from northeastern Texas, across the Central Mississippi Valley into the Ohio Valley during the first week of April, it should come as no surprise that the April precipitation outlook favors wetter-than-normal conditions in this region, with probabilities exceeding 60% for part of this region. Probabilities for a wet April in this area might have been even higher, except that an expected pattern change in Week 2 favors below-normal precipitation almost coast to coast. The Week 2, as well as the Week 3-4 outlooks, both favor above-average precipitation in southeastern Alaska and the Alaska Panhandle, which is carried onto the April outlook, albeit with modest odds. In contrast, below-normal precipitation is favored over parts of the Southwest, in peninsular Florida, and in southwestern Alaska, although odds are quite modest, peaking below 50%. CPC refers to this situation as “leaning toward” (but not strongly favoring) a particular temperature or precipitation outcome.
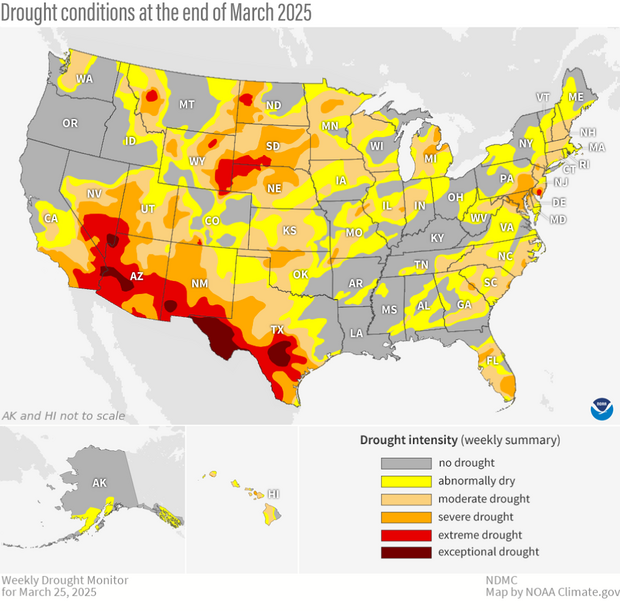
Drought conditions across the United States as of March 25, 2025. Drought conditions ranges from "abnormally dry" (yellow) to "exceptional" (dark red). Map by NOAA Climate.gov, based on data provided by the U.S. Drought Monitor project.
With a generally drier-than-average March in the books, it should come as no surprise that drought coverage across the country increased during the month, from about 42% at the end of February, to almost 45% at the end of March. The percent of the country in the two most intense categories (D3-D4, representing extreme and exceptional drought) also increased, from about 7% to just over 8%. Much of this D3 and D4 drought was located in the Southwest, where more than 25% of New Mexico and Texas were in one of these two categories, with over 50% of Arizona in extreme or exceptional drought.
Drought degradation was most prevalent across the southern and central Plains, with 2-3 class changes recorded across parts of New Mexico, Texas, Oklahoma, and Kansas. Degradation of 1-2 classes was common in the southern and central Appalachians and in south Florida. Modest improvement of 1-2 classes was observed in parts of the northern Rockies, central Plains, around the Great Lakes, in scattered parts of the Southeast, and along the Mid-Atlantic and Northeast coasts. Some drought removal was associated with this improvement, but drought continues to persist in most of these regions.
Drought Outlook predicts persistence in the West, some improvement in parts of the central U.S. and Northeast
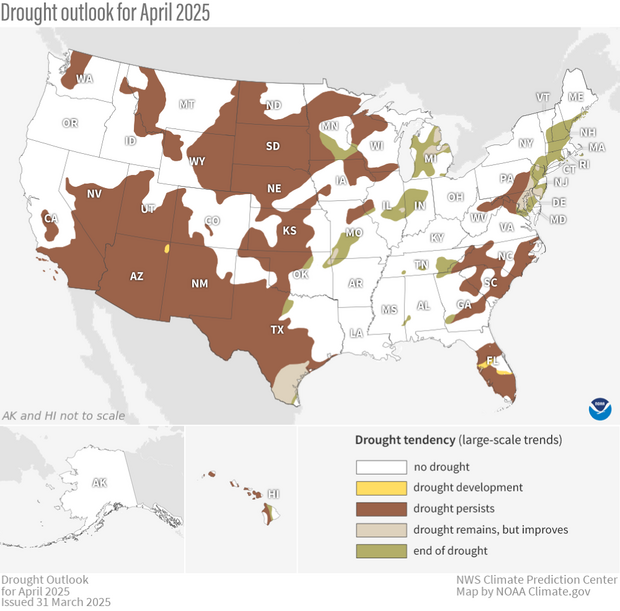
U.S. map of predicted drought changes or persistence in April 2025. NOAA Climate.gov map, based on data from the Climate Prediction Center (CPC). See CPC version for Alaska and Hawaii.
With above-normal precipitation favored only across parts of the center of the nation, drought persistence is likely across most of the western and eastern U.S. An exception does occur in parts of the Mid-Atlantic and Northeast, where heavy rains are predicted early in the period. However, this is a low-confidence forecast because areas that miss out on this early rainfall could see drought continuing into late April.
With above-average precipitation favored across parts of the Mississippi and Ohio Valleys, drought improvement or removal is likely across this region. Drought improvement is also likely in extreme south Texas, where recent heavy rainfall (exceeding 2 inches) supports drought improvement. Finally, with a monthly forecast favoring below-average rainfall in Florida, drought development is expected to the north of Lake Okeechobee, where rainfall deficits over the past 30 days exceeded 2 inches.
To read the entire discussion of the monthly climate outlooks from the Climate Prediction Center, check out their website.


