U.S. climate outlook for February 2024
After experiencing the warmest December in the historical record, winter finally appeared across the United States during January. Mid-January saw an Arctic outbreak that plunged temperatures well-below freezing across most of the country and brought the first measurable snowfall in the big cities of the mid-Atlantic and the Northeast in almost two years. Well above normal temperatures did return to the country at the end of the month, so what can we expect during the last month of meteorological winter. Will the cold and snow return for an encore presentation or will the warmth seen at the end of January continue? Let’s see what NOAA’s Climate Prediction Center (CPC) predicts for the last month of winter.
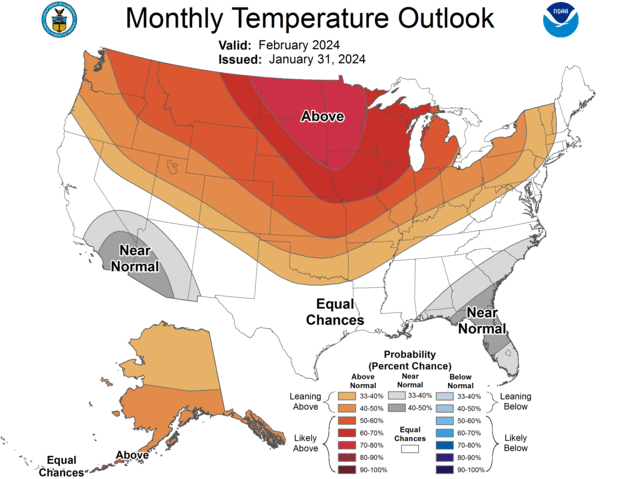
The U.S. temperature outlook for February 2024. At each location, three temperature outcomes are possible: well above average, near average, or well below average. The map uses colors to show which outcome is most likely: orange and red for warmer than average, gray for near average, and blues for cooler than average. The darker the color, the higher the probability of a given outcome, not how extreme it will be. White areas indicate that there are equal chances for a warm, cool, or near-average February. For more details on how to interpret these maps, read our explainer Understanding NOAA's monthly climate outlooks.
On January 31, CPC released its updated monthly climate outlooks for temperature, precipitation, and drought across the United States for February 2024. The temperature outlook favors well above normal temperatures across much of the northern half of the nation, and near-average temperatures in parts of the Southwest and Southeast. The precipitation outlook favors well above average precipitation (rain and/or snow) across large parts of the southern, central, and southeastern parts of the country, with well below average precipitation favored in the Pacific Northwest and around the Great Lakes, Ohio Valley, and in the Northeast.
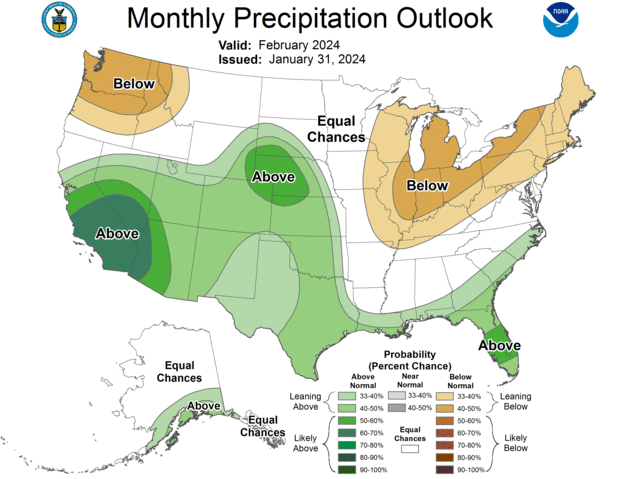
The U.S. precipitation outlook for February 2024. At each location, three outcomes are possible: much wetter than average, near average, or much drier than average. The map uses colors to show which outcome is most likely: greens for above average, gray for near average, and browns for below average. The darker the color, the higher the probability of a given outcome, not how extreme it will be. White areas indicate that there are equal chances for a wet, dry, or near-average February. For more details on how to interpret these maps, read our explainer Understanding NOAA's monthly climate outlooks.
Below, I’ll provide more detail about the outlooks and provide the rationale behind them. I’ll also discuss the current state of drought, how it changed during January, and how CPC expects drought to change during February. Finally, my ever-present reminder: that the colors on the temperature and precipitation outlook maps provide information about the most likely outcome, but other outcomes are still possible, although less likely to occur. More details about interpreting the outlooks can be found here.
The updated outlooks were produced considering the Week 1 forecast from the Weather Prediction Center (WPC), and CPC’s own Week 2 and Week 3-4 outlooks. Other tools that forecasters examined this month were longer-range forecast models such as the Global Ensemble Forecast System (GEFS), the Climate Forecast System (CFSv2), and products derived from these models.
El Niño remained strong during January across the tropical Pacific, and while it’s expected to begin weakening, impacts to the global climate will continue for at least the next few months, so it was again considered as the dominant teleconnection for the outlooks during February. The Madden-Julian Oscillation (MJO)—a conjoined area of heavy rains and clear, calm skies that travel the tropics together as a couplet—was also active, with its heavy rains located over the western Pacific at the end of January. However, computer models have a large degree of uncertainty on the future evolution of the MJO at this time, so forecasters considered the MJO’s potential influence only during the first two weeks of the month.
Temperature outlook
The February temperature outlook has enhanced odds for well above average temperatures across the northern half of the country from the Pacific Northwest through the central and northern Great Plains into parts of the Northeast. In contrast, near-average temperatures are favored in parts of the southwestern and southeastern U.S., with no parts of the country predicted to have a colder-than-average February. The highest odds for a warmer-than-average February reside in the Northern Plains, where probabilities exceed 70%, while odds for above-average temperatures in the Northeast are less than 50%.
The first week of February will begin with temperatures 20°-40° F above average across much of the northern Plains, and with temperatures strongly favored to remain above average in the CPC Week-2 Outlook, confidence is quite high that the monthly average will end up in the upper tercile. (Tercile refers to a third of the climate record.) Probabilities tilting toward above average extend both westward into the Pacific Northwest and eastward into the Northeast, but with lower probabilities.
After a warm start to the month in the West, Week-2 is favored to be below-average, but the Week 3-4 outlooks rebound back to favoring above-average temperatures. And while the first two weeks of February are likely to be milder than average in the Northeast, uncertainty increases during the second half of the month, possibly linked to a possibly linked to a major disruption of the polar vortex during the middle of January.
Near-average temperatures are favored for parts of the Southwest, where temperatures are favored to be near- to below average early in the month and near- to above average later in the month. Near-normal temperatures are also favored for coastal areas of the Southeast, where decadal temperature trends are positive and El Niño favors below-average temperatures.
Precipitation outlook
Well above average precipitation is favored across much of the southern part of the nation, with probabilities for a wet February highest in southern and central California and Nevada (exceeding 60%). This region is predicted to have substantial precipitation during the first week of the month, with amounts potentially exceeding the above-normal threshold for the entire month.
Farther east, above-average precipitation is favored northeastward into the Central Plains. Odds for a much wetter than average February exceed 50% for parts of this region, as normal February precipitation is relatively low and predicted amounts early in the month may also exceed the above-normal limit. Lower probabilities for above-average precipitation are found in the Southern Plains, and along the Gulf and South Atlantic Coasts, consistent with Week-2 and Week 3-4 Outlooks as well as typical impacts associated with El Niño.
Well below average precipitation is slightly favored in the Pacific Northwest, and in much of the Midwest and Northeast. Probabilities are all less than 50%, although CPC’s 6-10-day outlook tilts toward below average in the Northeast and the Week 3-4 Outlooks favor below-average precipitation in both of those regions. These outlooks are also consistent with typical impacts from El Niño during the late winter in the Pacific Northwest and in the Midwest.
Drought Monitor
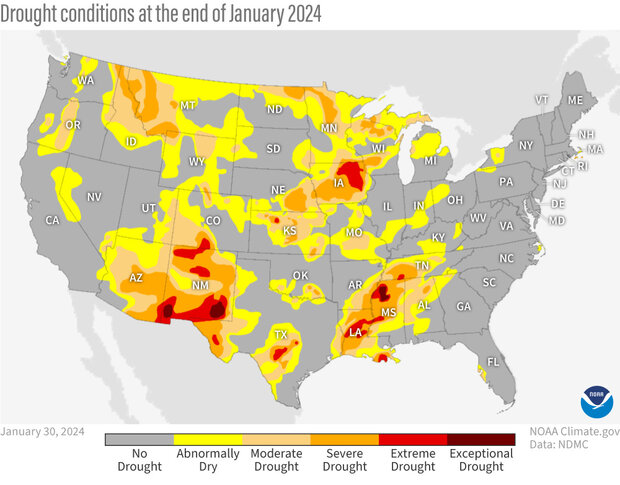
Drought conditions across the contiguous United States as of January 30, 2024. Yellow areas were abnormally dry, but not yet officially in drought. Drought intensity ranges from light orange (moderate drought) to dark red (exceptional drought). Map by NOAA Climate.gov, based on data from the U.S. Drought Monitor project. For more details, visit Drought.gov.
During January, the amount of drought across the United States decreased significantly, with the percent of the contiguous U.S. in drought decreasing from around 32.5% near the end of December to about 23.5% by the end of January. Additionally, the percent of the country in the two most intense categories (D3-D4, representing extreme and exceptional drought) also decreased, from about 6.5% to under 2.5%. This is the lowest amount of drought across the country since June 2023.
Drought improvement occurred across most of the country, with the exception of in the Northern Rockies and parts of the Southwest, where degradation was generally on the order of 1-2 classes. The most significant drought improvement occurred across parts of the Southeast and mid-Atlantic, where improvements of up to 3-4 classes were recorded. The improvement resulted in drought removal in the mid-Atlantic and improvements in the Tennessee Valley generally from extreme drought (D3) to either moderate drought (D1) or just abnormally dry (D0). Drought improvement in the Pacific Northwest resulted in some drought removal, while in the Central Plains, drought mainly improved 1-2 classes, from extreme (D3) to severe (D2) or even moderate (D1) levels.
Drought Outlook
The drought outlook for February favors improvement and/or removal in parts of the Southwest, southern and central Plains, and in the Southeast. Drought removal is predicted in regions currently in moderate drought, with improvement, but not removal, forecast for areas in more significant drought. Drought is expected to persist in other regions currently in drought, although drought development is not predicted for any new parts of the nation during the month.
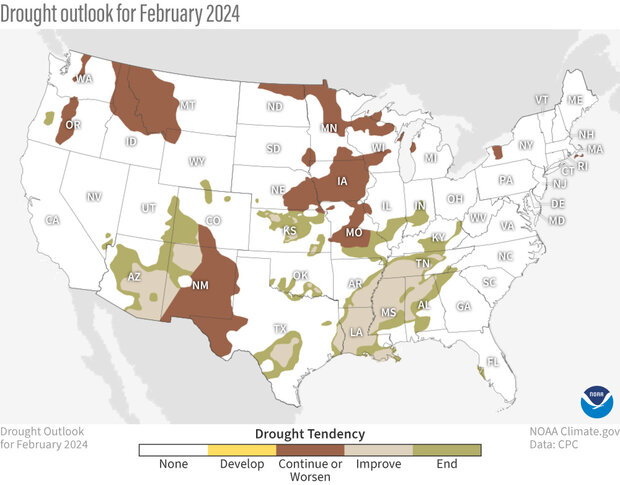
The U.S. drought outlook for February showing where drought conditions are likely to end (green), improve (tan), or persist or worsen (dark brown) this month. No new areas are expected to see drought develop. NOAA Climate.gov image, based on data from the Climate Prediction Center.
Improvement in Arizona and western parts New Mexico and Colorado is consistent with forecasts for above-normal precipitation. However, despite the tilt toward above-normal precipitation, drought persistence is predicted for the remainder of New Mexico, as February is a rather dry time of the year. A typically active southern storm track associated with the background El Niño state favors above-average precipitation and drought improvement and removal for parts of central and eastern Texas, and in the Lower Mississippi and Tennessee Valleys. Other regions across the nation where drought is likely to persist are either favored to experience a drier-than-normal February or are locations that are typically dry during the late winter.
To read the entire discussion of the monthly climate outlooks from the Climate Prediction Center, or to see shorter-term outlooks, check out their website.