U.S. climate outlook for February 2025
For those living in the southern, central, or eastern parts of the nation—who might have forgotten what winter could be like following last winter’s record-warmth—Mother Nature provided a hard-hitting reminder during January. Temperatures averaged below normal from coast-to-coast during the month, but periodic intrusions of Arctic air were most prevalent into the central and eastern U.S. One particularly cold outbreak resulted in temperatures well below freezing all of the way to the Gulf Coast, which followed a record-breaking southern snowstorm, where totals exceeding 6 inches were quite common along the Gulf Coast.
Despite the snowstorm and a few other snow events in the East, precipitation during January was below-average across almost the entire country, with a few exceptions in parts of the Great Plains and in Florida. This included very dry conditions in the West, which helped to set the stage for the devastating wildfires that occurred around Los Angeles. As we head into the last month of meteorological winter, will winter retain its icy grip across large parts of the nation or will milder weather return? And after another dry month, will rain (and snow) become more prevalent across the country? Here’s what NOAA’s Climate Prediction Center (CPC) predicts for February.
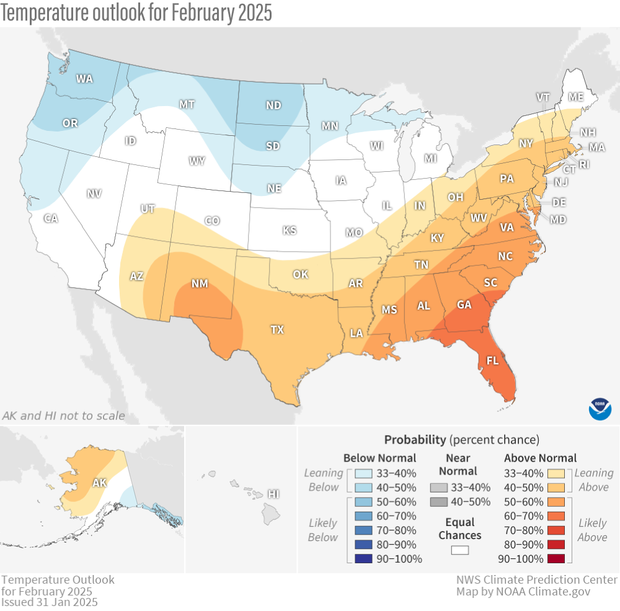
The U.S. temperature outlook for February 2025, showing where the monthly temperature is favored to be much warmer than average (orange and red) for November or much cooler than average (blues). Darker colors mean higher chances, not more extreme temperatures. White areas mean that there are equal chances for a warm, cool, or near-average February. Much warmer or much cooler than average means "in the upper or lower third" of average February temperatures from 1991-2020. Text-only forecast for Hawaii available from NOAA Climate Prediction Center.
On January 31, CPC released its updated monthly climate outlooks for temperature, precipitation, and drought across the United States for February 2025. The temperature outlook favors well above average temperatures across the southern and eastern parts of the nation, as well as in northern and western Alaska. Below-average temperatures are favored across parts of the northern and western U.S., as well as in southeastern Alaska. The precipitation outlook favors well above average precipitation in the Pacific Northwest, Northern Rockies, around the Great Lakes, in the Ohio and Tennessee Valleys, in the Northeast, and in western and northern Alaska, with below-average precipitation favored only in parts of the Southwest and Florida.
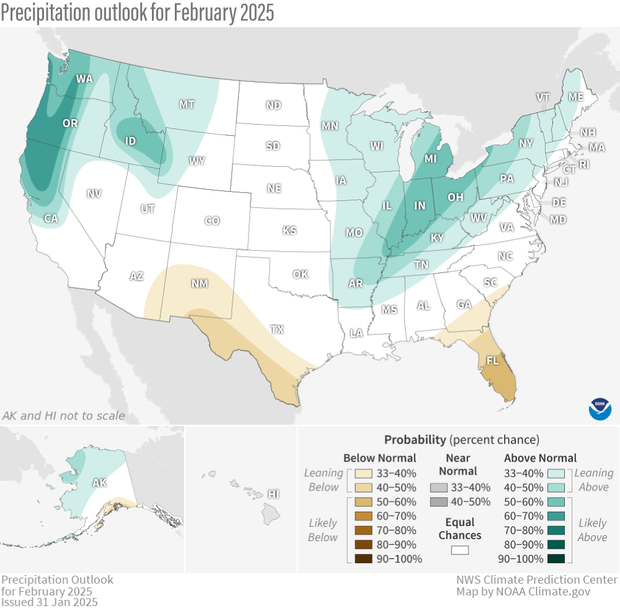
The precipitation outlook for February 2025, showing where the average precipitation (rain and snow) is favored to be much higher than average (greens) or much lower than average (browns). Darker colors mean higher chances, not more extreme precipitation departures. White areas mean that there are equal chances for a wet, dry, or near-average February. Much higher or much lower than average means "in the upper or lower third" of total February precipitation amounts from 1991-2020. Text-only forecast for Hawaii available from NOAA Climate Prediction Center.
Throughout the remainder of this post, I’ll talk about the basis for the outlooks and provide more specific information about them, discuss the changes in drought that occurred during January, and provide the drought outlook for February. Finally, don’t forget (how could you) that the colors on the temperature and precipitation outlook maps provide information about the most likely outcome, but other outcomes are still possible, just less likely. More details about interpreting the outlooks can be found here.
The monthly outlooks were produced considering the Week 1 forecast from the Weather Prediction Center (WPC), and CPC’s own 6-10 day, Week-2, and Week 3-4 outlooks. Other tools that forecasters examined this month included longer-range forecast models such as the Global Ensemble Forecast System (GEFS), the Climate Forecast System (CFSv2), and the European Ensemble Forecast System (ECMWF) as well as products derived from these models. With La Niña finally arriving, it played a fairly significant role in the outlooks for February. And with the Madden-Julian Oscillation (MJO) remaining active, recently propagating into the Maritime Continent (phases 4-5) and expected to propagate into the Western Pacific (phases 6-7), forecasters also considered temperature composites based on average patterns during past occurrences of these phases.
February outlook favors mild temperatures in the South and East
The February temperature outlook favors well above average temperatures across most of the southern and eastern parts of the nation and in northern and western Alaska. (Well above average means “in the warmest third of all Februarys in the recent climate record.”) Below-average temperatures are favored across parts of the northern U.S. (from the western Great Lakes westward) and in southeastern Alaska. The predicted circulation during much of the month (6-10 day, Week-2, Week 3-4) is quite consistent with a typical La Niña response. This features an amplified trough across much of the western and north-central U.S. (jet stream shifted south of normal) and ridging over the southern tier and along the East Coast (jet stream shifted north of normal). This circulation pattern is also consistent with the MJO propagating into the Western Pacific and influencing atmospheric circulation “downstream” in the United States.
With support for this pattern found across all time periods and also its consistency with La Niña, probabilities for above-average temperatures are fairly high (greater than 60%) over Florida and exceed 50% for much of the Southeast and in parts of the Southwest. Below-normal February temperatures are favored across the north from the Pacific Northwest to the western Great Lakes and in southeastern Alaska. These regions often experience below-average temperatures during La Niña winters, and relative coolness is also consistent with CPC’s Week-2 and Weeks 3-4 outlooks.
February precipitation resembles La Niña composite, with wet across some of the North and dry across parts of the South
The precipitation outlook again (as it did in January) resembles a La Niña-like response over the key winter teleconnection regions of the U.S. Specifically, the February outlook favors above-average precipitation in the Pacific Northwest, across the northern Rockies, and in an expansive area which includes most of the Mississippi Valley, the Great Lakes region, the Ohio and Tennessee Valleys, interior portions of the Mid-Atlantic and Northeast, and also in western and northern Alaska. The best odds are in the Pacific Northwest (60-70%), where WPC predicts 3-8 inches of rain during the first week of the month and CPC’s longer-term outlooks (Week-2 and Weeks 3-4) tilt toward above-average precipitation.
Probabilities exceed 50% from the vicinity of the Mississippi-Ohio River confluence northeastward across most of the eastern half of the Great Lakes, where all CPC outlooks favor above-average precipitation, which is consistent with map composites during past La Niña winters. Odds favoring below-average rainfall are enhanced for eastern Arizona, most of New Mexico, western and southern parts of Texas, most of the South Atlantic region, and in southern Alaska. This pattern is also consistent with a La Niña response and generally indicated in CPC’s shorter- (Week-2) and longer-range (Weeks 3-4) outlooks. Greatest odds are found over southern Florida (greater than 50%), which tilts dry in all outlooks and is also the most reliable La Niña dry signal in the Southeast.
U. S. Drought area remains fairly steady during January
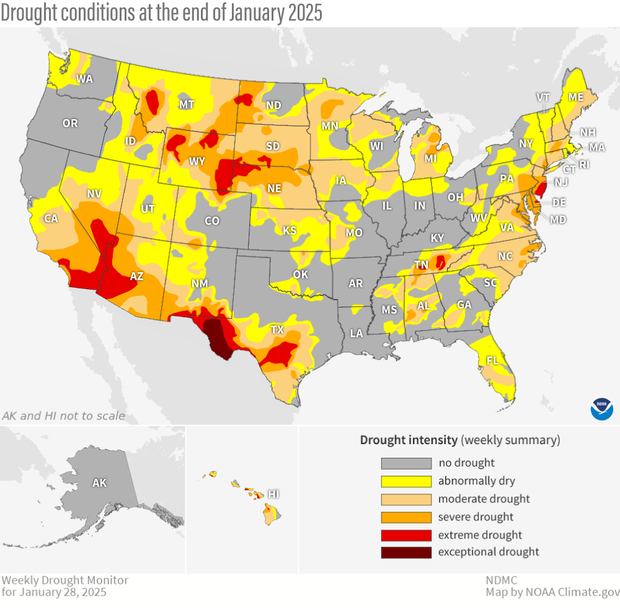
Drought conditions across the contiguous United States as of January 28, 2025. Drought conditions ranges from "abnormally dry" (yellow) to "exceptional" (dark red). Map by NOAA Climate.gov, based on data provided by the U.S. Drought Monitor project.
Despite a very dry month over almost the entire country, drought coverage remained fairly steady during January, with slightly less than 40% of the nation experiencing some level of drought at the end of the month, compared to 38% at the end of December. The percent of the country in the two most intense categories (D3-D4, representing extreme and exceptional drought) remained steady at about 5%.
Regionally, drought degradation was almost entirely on the order of 1 or 2 classes, with the most significant degradation occurring in southern California, where severe and extreme drought became widespread. (Fortunately, the region’s winter wet season appears to have finally begun.) Drought also intensified in the Southwest, central Texas, and in the southern Mid-Atlantic.
In contrast, despite only normal precipitation, drought improvement was recorded across parts of the Pacific Northwest and parts of the Southeast, with the greatest improvement occurring in the Florida Panhandle, coincident with a region that did record above-average precipitation during the month.
Drought Outlook predicts persistence and development across the South; Limited improvement across parts of the North
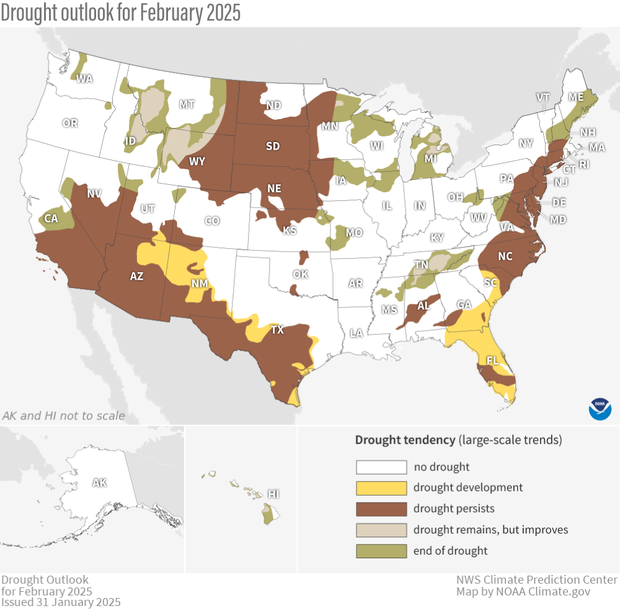
U.S. map of predicted drought changes or persistence in February 2025. A few new areas of drought are likely to develop (yellow) across portions of the Southeast and Southwest. Existing drought in those areas, along with the Northern Plains and Mid-Atlantic seaboard, is likely to continue or worsen (brown). A few areas in the Northwest, Great Lakes, and Southeast are expected to improve by at least 1 category (tan) or end (green). NOAA Climate.gov map, based on data from the Climate Prediction Center (CPC). See CPC version for Alaska and Hawaii.
Given ongoing La Niña conditions and the monthly forecast favoring above-average precipitation across parts of the northern half of the country, drought improvement (with some removal) during February is likely in the northern Rockies, parts of the Midwest, and in parts of the mid-Atlantic and Northeast. Persistence is likely throughout much of the High Plains, given a precipitation outlook with no tilt in the odds towards any category (equal chances of above-, below-, or normal precipitation) and the fact that average precipitation during February is low in the region. Drought persistence is also likely in in the remainder of the Mid-Atlantic and Northeast, despite the monthly forecast weakly favoring above-average; amounts may not be enough to warrant improvement across areas with existing significant precipitation deficits.
With odds favoring below-average precipitation across parts of the Southwest and Southern Plains, drought persistence and some development is likely during the month. Drought is also expected to persist across the southern mid-Atlantic, and develop south of this region into Florida, where outlooks favor a drier-than-normal month.
To read the entire discussion of the monthly climate outlooks from the Climate Prediction Center, check out their website.