U.S. climate outlook for January 2024
The first month of meteorological winter is officially in the books and most folks across the United States are still waiting for winter to arrive. Temperatures during December averaged above normal from coast to coast, with departures exceeding +10°F common across parts of the northern Great Plains. This is consistent with the winter outlook issued by the NOAA’s Climate Prediction Center (CPC) on October 19th 2023, which favored above-average temperatures over the northern half of the nation, and with no parts of the country favored to experience a colder-than-average winter. Will this mild winter weather continue throughout January, or will winter rear its ugly (and cold) head? Let’s see what CPC predicts for the month ahead.
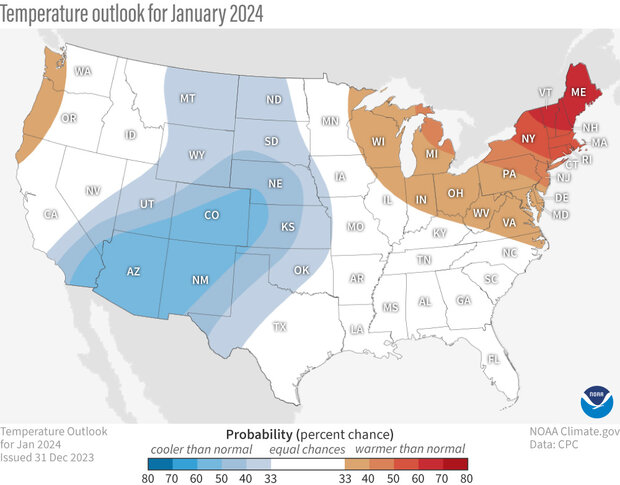
The U.S. temperature outlook for January 2024 (view Alaska), showing places where a much warmer than average January is favored (orange to red) or where a colder-than-average January is favored (blue). White areas indicate that there are equal chances for a warm, cool, or near-average January. For more details on how to interpret these maps, read our explainer Understanding NOAA's monthly climate outlooks. Map by NOAA Climate.gov, based on data from the Climate Prediction Center.
On December 31, CPC released its updated monthly climate outlooks for temperature, precipitation, and drought across the United States for January 2024. The temperature outlook favors well above normal temperatures across the Northeast and around the Great Lakes and well below average temperatures in the Southwest and central and northern Great Plains. The precipitation outlook favors well above average precipitation (rain and/or snow) across large parts of the southern, central, and eastern parts of the country, with well below average precipitation not favored anywhere over the Lower 48.
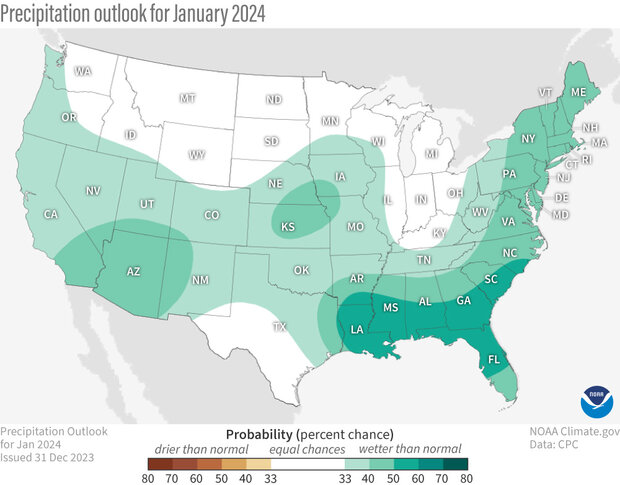
The U.S. precipitation (rain + snow) outlook for January 2024 (view Alaska), showing places where a much wetter than average January is favored (green) or where there are equal chances for a wet, dry, or near-average January (white areas). For more details on how to interpret these maps, read our explainer Understanding NOAA's monthly climate outlooks. Map by NOAA Climate.gov, based on data from the Climate Prediction Center.
Below, I’ll provide a more focused discussion of the outlooks as well as the basis for them. I’ll also discuss the current state of drought, how it changed during December, and what to expect in the way of drought changes during January. And of course, here’s my monthly reminder that the colors on the temperature and precipitation outlook maps only provide information about the most likely outcome, but other outcomes are always possible, just less likely to occur. More details about interpreting the outlooks can be found here.
The updated outlooks were produced considering the Week 1 forecast from the Weather Prediction Center (WPC), and CPC’s own Week 2 and Week 3-4 outlooks. Other tools that forecasters considered this month were various longer-range forecast models such as the Global Ensemble Forecast System (GEFS), the Climate Forecast System (CFSv2), and products derived from these models. El Niño remained strong during December across the tropical Pacific and was again considered as a dominant teleconnection for the outlooks during December. But the Madden-Julian Oscillation (MJO)—a conjoined area of heavy rains and clear, calm skies that travel the tropics together as a couplet—was also active at the end of the month after circumnavigating the Tropics during December. At the time the January outlook was issued, the MJO was over the Indian Ocean. Since the MJO is predicted to remain active and slowly progress towards the Maritime Continent and then the western Pacific during the first half of January, potential MJO impacts were also considered.
Temperature outlook
The December temperature outlook has enhanced odds for well below average temperatures in a region out West extending from southern California and the Southwest, eastward and northward to the Great Plains. In contrast, well above average temperatures are favored around the Great Lakes, in the mid-Atlantic and Northeast, and along the Pacific Northwest Coast. The highest odds for a warmer-than-average January reside in New England, where probabilities exceed 50%. Elsewhere, odds exceed 50% for below-average temperatures in parts of the Southwest.
Forecast confidence is greatest in New England, where above-average temperatures are most likely given the consistent signals in the various forecasts for above-average temperatures during each week of the month. Well below average temperatures are favored in parts of the West, as the negative phase of the Arctic Oscillation (AO) is predicted during the first half of January along with a high-amplitude trough (a dip in the jet stream) predicted to become established over the West and Great Plains. The greatest likelihood for a colder-than-average January is over the Southwest (> 50%), as above-average temperatures will dominate the Northern Plains early in the month and are again predicted during the Week 3-4 period.
Precipitation outlook
Well above average precipitation during January is favored across much of the country, except for in the Northern Plains, Ohio Valley, and western and southern Texas, where the forecast is for equal chances (EC), meaning that there is no tilt in the odds toward above-, near-, or below-average precipitation. Probabilities exceed 50% along the Gulf and South Atlantic Coasts, as 1-3 inches of rainfall is predicted during the first week of the month and forecasts at all longer time ranges continue to favor above-average precipitation. Probabilities for enhanced precipitation are also elevated along the entire East Coast, as the Week 2 and Week 3-4 outlooks favor above-average precipitation. Probabilities for above-average precipitation are also elevated along the West Coast and in the Southwest, but with modest probabilities, due to uncertainty on the location of the primary storm track.
Below-normal precipitation is not favored in any parts of the country. Although the first week of the month is expected to be dry across the Northern Plains, around the Great Lakes, and in the Ohio Valley, the Week 2 forecast leans wet, so the outlook for these regions was for equal chances of above-, near-, or above-normal precipitation.
Drought Monitor
During December, the amount of drought across the United States decreased, with the percent of the contiguous U.S. in drought decreasing from around 36% near the end of November to about 32.5% by the end of the year. Additionally, the percent of the country in the two most intense categories (D3-D4, representing extreme and exceptional drought) also decreased, from just under 8% to about 6.5%.
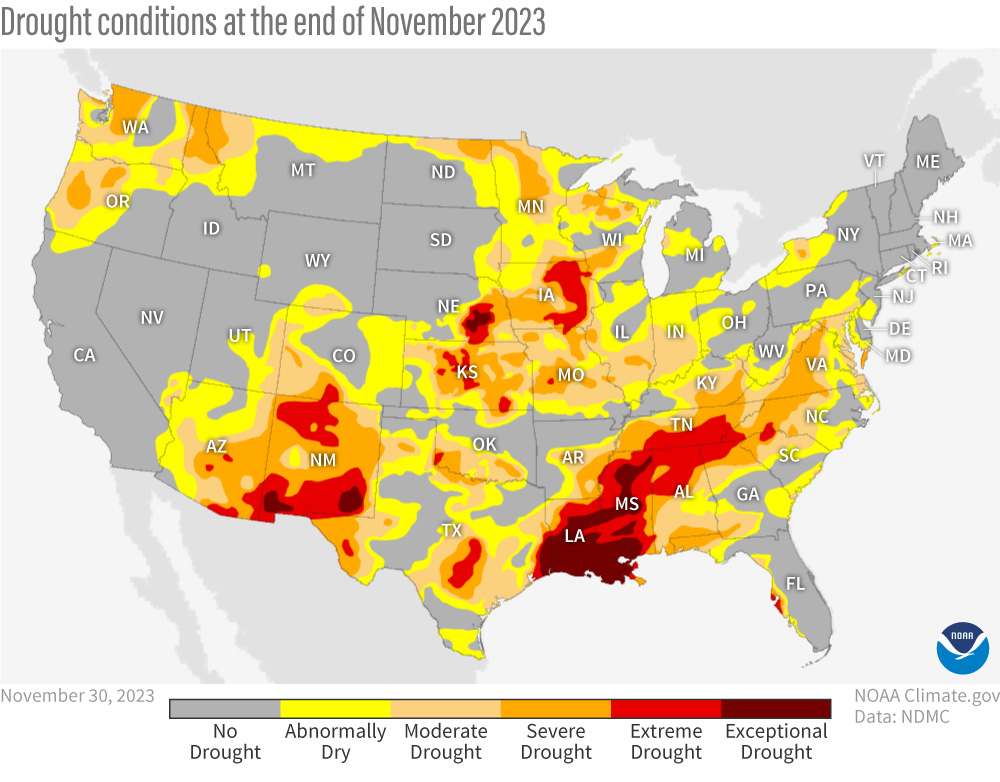
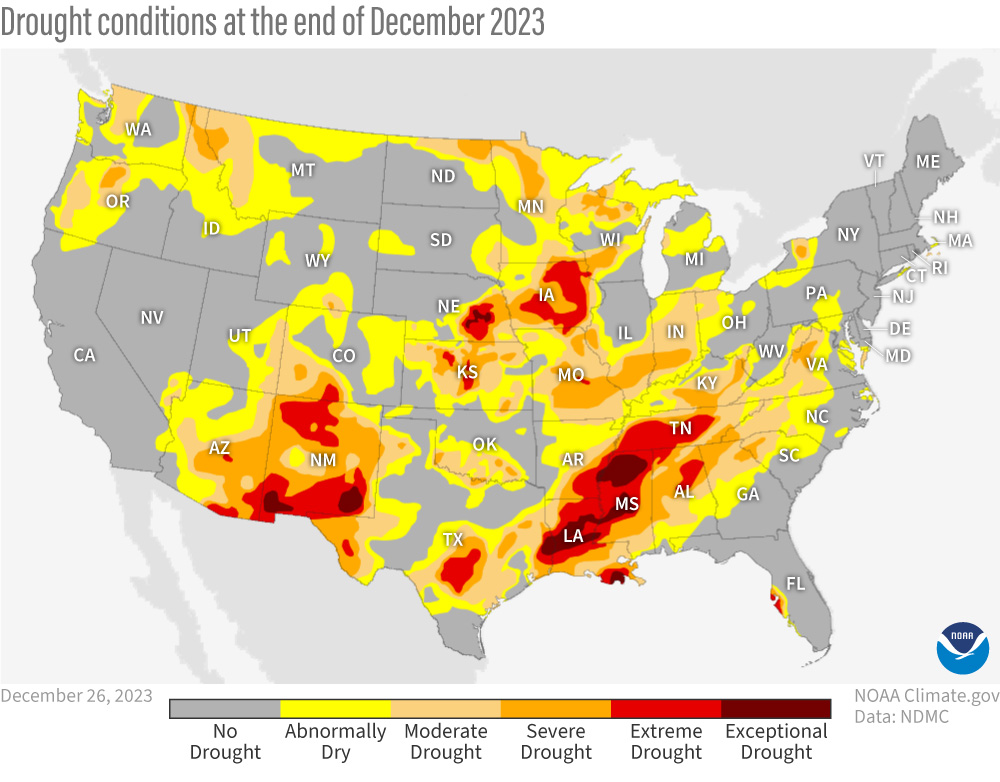
Click and drag slider to compare how drought conditions changed between the end of November and the end of December 2023. Some areas of extreme (red) and exceptional (dark red) drought remained in place in the Southwest, the heart of the Great Plains, and the South. NOAA Climate.gov maps, based on data from the U.S. Drought Monitor Project. For more details on drought, visit Drought.gov.
The most significant drought improvement occurred along the Gulf Coast, with improvements of up to 3 classes recorded from southern Alabama to the Florida Panhandle. Some limited drought improvement was also observed in the Pacific Northwest (1-2 classes) as well as in parts of the southern and central Plains, and in the Southeast and mid-Atlantic. In contrast, drought degradation was recorded in parts of the Ohio and Tennessee Valleys (generally 1-2 classes) and in the northern Rockies (mainly 1 class).
Drought Outlook

The January 2024 drought outlook for the contiguous United States (view Alaska, Hawaii, and Puerto Rico). Yellow areas are likely to see drought develop. Brown areas are likely to see drought persist. Tan means drought is likely to improve at least 1 category, and green means drought is likely to end. NOAA Climate.gov map, based on data from NOAA Climate Prediction Center.
The drought outlook for January favors improvement and/or removal in parts of the Pacific Northwest, parts of the Southwest, and in the Southeast extending up the Appalachians to the mid-Atlantic. Drought removal is predicted in regions currently in moderate drought, with improvement, but not removal, forecast for areas in more significant drought. Drought is expected to persist in other areas currently experiencing drought, despite the slight tilt toward above-average precipitation in some of these regions, as winter is a drier time of year in these locations. However, with no area of the country favored to experience a drier-than-average January, drought development is not predicted for any part of the nation.
The anticipated cold and wet start to the month in the Pacific Northwest favors an improvement in snowpack and drought, although drought persistence is predicted in the Intermountain West, due to larger precipitation deficits there. In the Southwest, improvement is likely to be more targeted, with a broad area of improvement and removal depicted in areas where there is at least a 40% chance of above-average precipitation during January. Finally an active southern storm track associated with the background El Niño state favors drought improvement and removal for parts of East Texas, the Lower Mississippi and Tennessee Valleys, in the Southeast, and mid-Atlantic.
To read the entire discussion of the monthly climate outlooks from the Climate Prediction Center, check out their website.