U.S. climate outlook for June 2023
After a cooler-than-average May in the eastern and southwestern parts of the nation and above-average temperatures across much of the rest of the country, what does NOAA’s Climate Prediction Center (CPC) expect for the first month of meteorological summer?
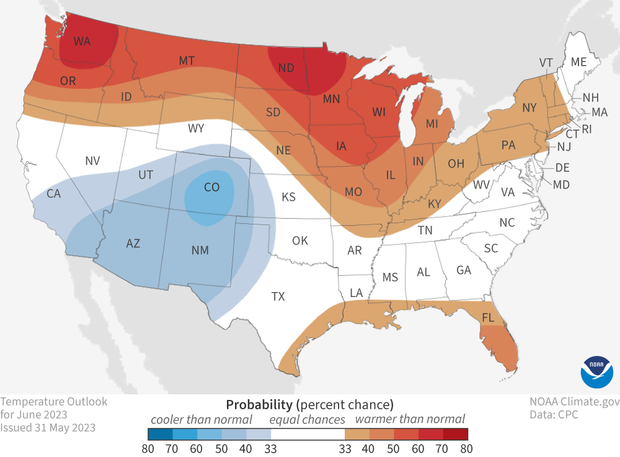
The U.S. temperature outlook for June 2023 (view Alaska). showing places where a much warmer than average June is favored (reds) and where a much cooler than average June is favored (blues). White areas indicate that there are equal chances for a warm, cool, or near-average June. For more details on how to interpret these maps, read our explainer Understanding NOAA's monthly climate outlooks. Map by NOAA Climate.gov, based on data from the Climate Prediction Center.
On May 31, CPC released its updated monthly climate outlooks for temperature, precipitation, and drought across the United States for June 2023. In general, the outlooks favor well above normal temperatures across the northern part of the country and right along the Gulf Coast, with odds favoring well below average temperatures in the Southwest. The precipitation outlook favors well above average precipitation across much of the western half of the country and well below-average precipitation around the Great Lakes from the northern Plains through the Ohio Valley to western New York and Pennsylvania.
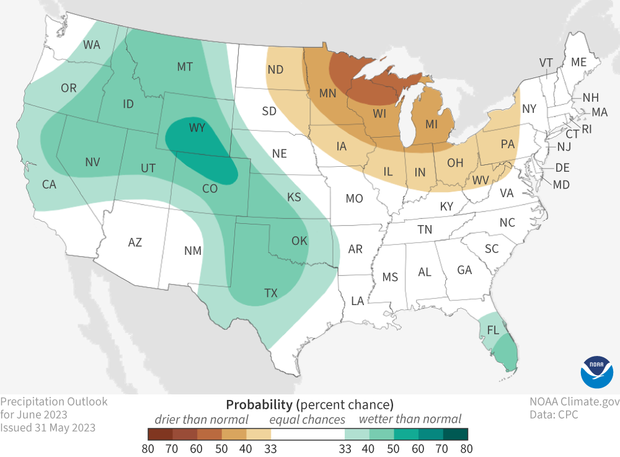
The U.S. precipitation outlook for June 2023 (view Alaska), showing places where a much wetter than average June is favored (greens) and where a much drier than average June is favored (browns). White areas indicate that there are equal chances for a wet, dry, or near-average June. For more details on how to interpret these maps, read our explainer Understanding NOAA's monthly climate outlooks. Map by NOAA Climate.gov, based on data from the Climate Prediction Center.
Below, I’ll discuss the temperature and precipitation outlooks and the factors behind them, as well as the current state of drought and the monthly drought outlook for June. Mandatory reminder about the maps (more details): Temperature and precipitation outlook maps show only the most likely outcome, but other outcomes are always possible, just less likely to occur.
These updated outlooks were produced considering the week 1 forecast from the Weather Prediction Center (WPC), and CPC’s own week 2 and week 3-4 outlooks. Other tools that forecasters used included various forecast models such as the Climate Forecast System (CFSv2), current soil moisture condition (potentially important during the summer months), and the current and forecasted state of the Madden Julian Oscillation (MJO), since activity was ongoing at the end of May and some forecasts imply this may continue, at least into the early part of June. The MJO (a global-scale pattern in tropical winds and rain) impacts the jetstream across the Pacific at times, influencing the patterns of temperature and precipitation over the United States on the weekly time scale. More details about the MJO can be found here and here.
Temperature Outlook
The June temperature outlook favors well above average temperatures across the northern tier from the Pacific Northwest to the Northeast, with the strongest signal in Washington state and parts of North Dakota and Minnesota (60-70%). Areas across the north from the Great Lakes westward were significantly above average during May, and odds tilt fairly strongly in the same direction during at least the first 10 days to two weeks of the month. A very slight tilt in the odds toward above-average temperatures is also found along the Gulf Coast and in Florida, with well above normal sea surface temperatures in the Gulf of Mexico the primary factor for this outlook.
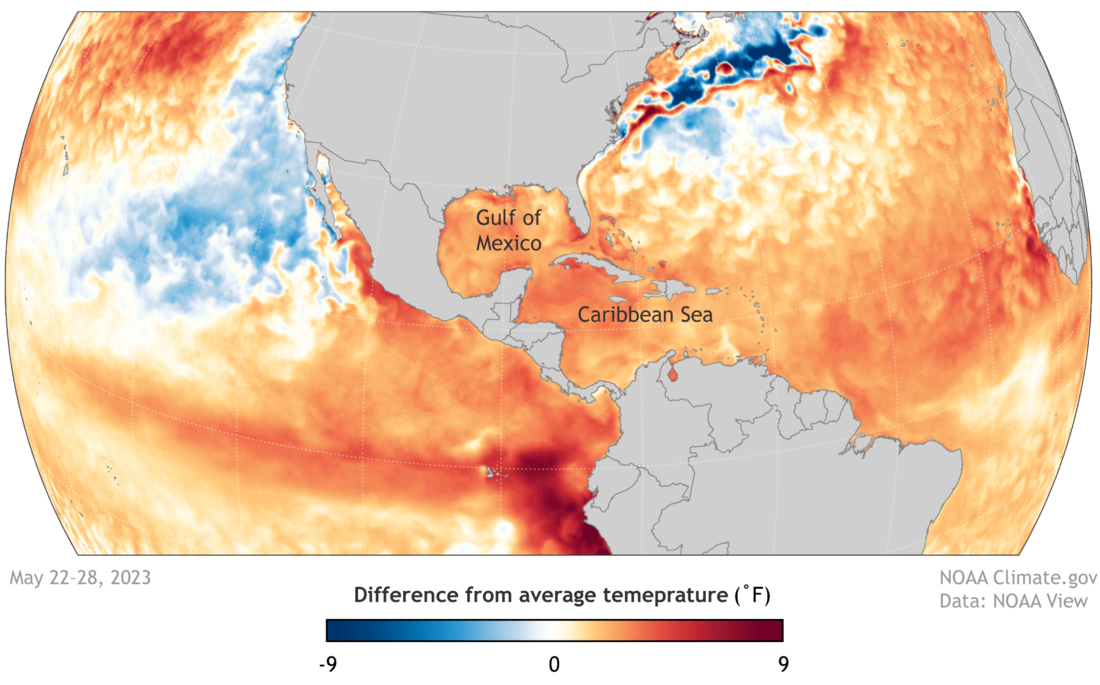
Sea surface temperatures from May 22-28, 2023, compared to the long-term average. Waters across the Gulf of Mexico were warmer than-average (reds and oranges). NOAA Climate.gov image, based on Coral Reef Watch data.
In contrast, the outlook favors well below-average temperatures in the Southwest extending westward into central and southern California. Probabilities are somewhat lower here, with the most confident forecast (50-60%) only favored over parts of Colorado and northern New Mexico. Below-average temperatures early in June associated with a trough of low pressure and continued support in the mid (week-2) and longer-term outlooks (weeks 3 and 4) for below-average temperatures, along with very wet topsoil in much of this region all favor a cooler-than-average June.
Precipitation Outlook
As is almost always the case, the largest probabilities on the precipitation outlook for June are lower than on the temperature maps, indicating less confidence in the outlook. (Precipitation is just harder to forecast than temperature, so confidence is almost always lower). Although above-average precipitation is favored across large parts of the western part of the U.S., probabilities only exceed 50% in a small region in Wyoming and Colorado. And normal rainfall amounts in some of this expansive area (particularly in California and Nevada) are quite low in June (e.g., San Francisco normal is less than a quarter of an inch), so even above-normal rainfall isn’t likely to result in large amounts of precipitation.
Rainfall is also slightly favored to be above-average in southern Florida, with heavy rainfall anticipated early in the month and the lack of a dry signal among all of the tools at later time scales factoring into this prediction.
Drier-than-average conditions are favored during June across parts of the northern U.S. from the eastern Dakotas across the Great Lakes to western Pennsylvania and New York. Again, odds only exceed 50% in a small part of this area (northeastern Minnesota, northern Wisconsin and the Upper Peninsula of Michigan), with a confident dry start to the month somewhat negated by uncertainty over much of the region for mid- to late month.
Drought Monitor
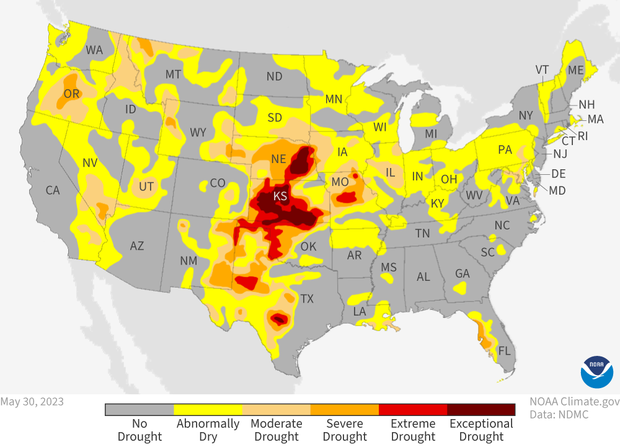
Drought conditions across the contiguous United States as of May 30, 2023. Extreme (red) and exceptional (dark red) drought was confined to the heart of the Great Plains. NOAA Climate.gov map, based on data from the U.S. Drought Monitor Project. For more details on drought, visit Drought.gov.
Drought continued to improve across the United States in late spring, with the percent of the contiguous U.S. in drought decreasing from about 25% at the end of April to under 19% by the end of May. This is the least amount of drought in 3 years (since late May 2020). The percent of the country in the two worst categories (D3-D4) also decreased during May to just over 3%, the lowest level since August 2020. In fact, more of the country was in the two worst categories of drought in August 2022 than is in any category of drought now.
In the last month, drought improved significantly in Florida (up to a 3-class improvement) and also in much of the southern and western Plains, and parts of the mid-Atlantic. However, drought has developed or worsened from the Midwest into the Northeast, with degradation of 2-3 classes in Missouri. And drought continues to be a significant concern in the central and southern Plains, with much of Kansas and eastern Nebraska mired in exceptional drought.
Drought Outlooks
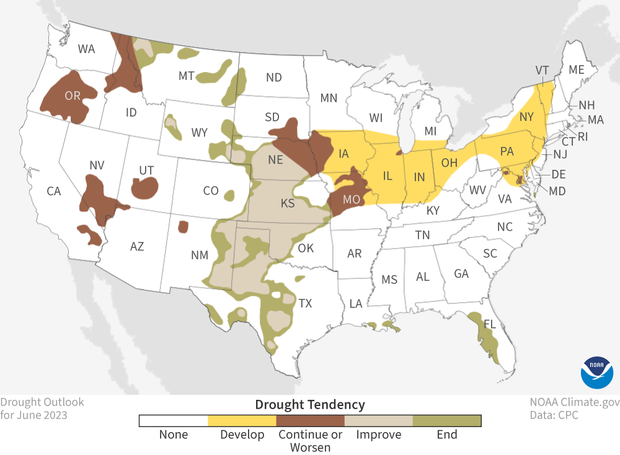
The June 2023 drought outlook for the contiguous United States (view Alaska). Yellow areas are likely to see drought develop. Brown areas are likely to see drought persist. Tan means drought is likely to improve at least 1 category, and green means drought is likely to end. NOAA Climate.gov map, based on data from NOAA Climate Prediction Center.
For June, drought is likely to improve in the central and southern Plains (but with drought continuing at some level in most of this region), with drought removal likely in Florida and in parts of the northern Rockies. In contract, drought persistence is likely in the Pacific Northwest and also further south in Nevada, Utah, and California despite the precipitation outlook for June favoring an above-average outcome (normal rainfall out West is generally quite low during this month).
Drought persistence is also likely in parts of the Central Plains (eastern Nebraska, western Iowa, central and northern Missouri, and southern South Dakota). Drought is also predicted to develop in a large swath from the central Plains eastward across Indiana, Illinois, and Ohio, into parts of the Northeast and mid-Atlantic. This area has been quite dry for at least the past month and is favored to experience a drier-than-average month in June.
To read the entire discussion of the monthly climate outlooks from the Climate Prediction Center, check out their website.