U.S. climate outlook for May 2023
On April 30, NOAA’s Climate Prediction Center (CPC) released its updated monthly climate outlooks for temperature, precipitation, and drought across the United States during May 2023. As is typical for forecasts made in transition seasons (spring and fall), the Earth system is sending mixed signals about what we might expect, which means that most of the probabilities are fairly modest: odds are leaning toward a particular outcome, but not strongly. The strongest signals are a 50-60 percent chance of a much warmer than usual May in parts of the Pacific Northwest, and a 50-60 percent chance of a much wetter than average May in Northern California.
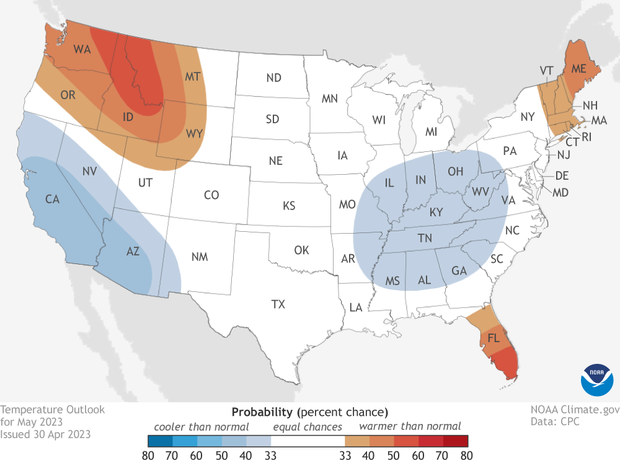
U.S. map showing the favored temperature outcome for May 2023 for each part of the contiguous United States (view Alaska). Warm colors indicate much warmer than average temperatures are favored, while cool colors mean much cooler than average temperatures are favored. White areas mean equal chances for above- near-, or below average temperatures. NOAA Climate.gov map, based on data from NOAA Climate Prediction Center.
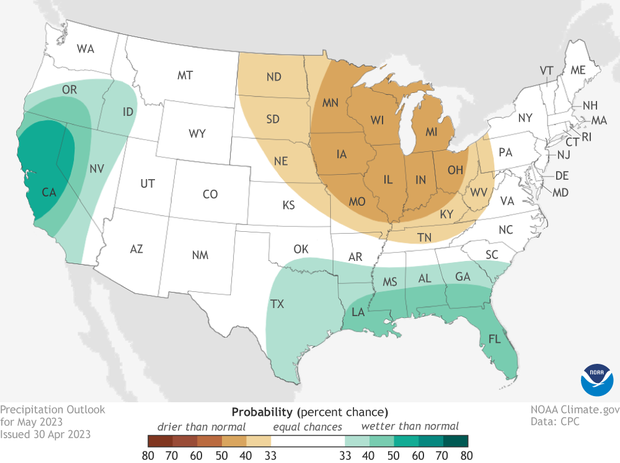
U.S. map showing the favored precipitation outcome for May 2023 for each part of the contiguous United States (view Alaska). Green colors indicate much wetter than average conditions are favored, while brown colors mean much drier than average conditions are favored. White areas mean equal chances for above- near-, or below average precipitation. NOAA Climate.gov map, based on data from NOAA Climate Prediction Center.
Understanding the maps
Below, I’ll discuss the temperature and precipitation outlooks and the factors behind them, how they’ve changed from the outlooks released on April 20, as well as the monthly drought outlook. But first, here are some reminders on how to read the maps:
- Maps show the probability (percent chance) that monthly average temperature or precipitation will be in the upper, middle, or lower third of the climatological record (1991-2020) for May. We refer to these categories as “well above” and “well below” average.
- White does not mean average. It means that well above, well below, or near-average conditions have equal chances (33 percent) of occurring.
- The colors on the maps (red or blue for temperatures, brown or teal for precipitation) indicate which outcome is the most likely. However, other outcomes are also possible—you’ll never see a probability of 100 percent on the map— just less likely to occur.
- Darker colors reflect higher chances of the indicated outcome, not that more extreme conditions will happen.
[Head to the end of the post for more on the math behind the probabilities, including how experts calculate the probability of the less likely (but still possible!) outcomes.]
These outlooks were updated from initial versions released on April 20, factoring in the Week 1 forecast from the Weather Prediction Center (WPC), and CPC’s own Week 2 and Week 3-4 outlooks, with more weight given to the shorter-term outlooks. Other tools that forecasters used included various forecast models such as the Climate forecast System (CFS), current soil moisture conditions, and the current and forecasted state of the Madden Julian Oscillation (MJO), since activity was ongoing at the end of April.
Temperature outlook
The May temperature outlook favors well above average temperatures in the Pacific Northwest, New England, and Florida, with a tilt towards well below average temperatures in California and the U.S. Southwest, and in the Ohio and Tennessee Valleys. Probabilities are fairly modest across the entire country, with the odds only exceeding 50% in the Pacific Northwest and southern Florida. This tentativeness is fairly typical for forecasts issued during the transition seasons (spring and fall), as forecast tools often provide mixed signals as to what to expect over the next month.
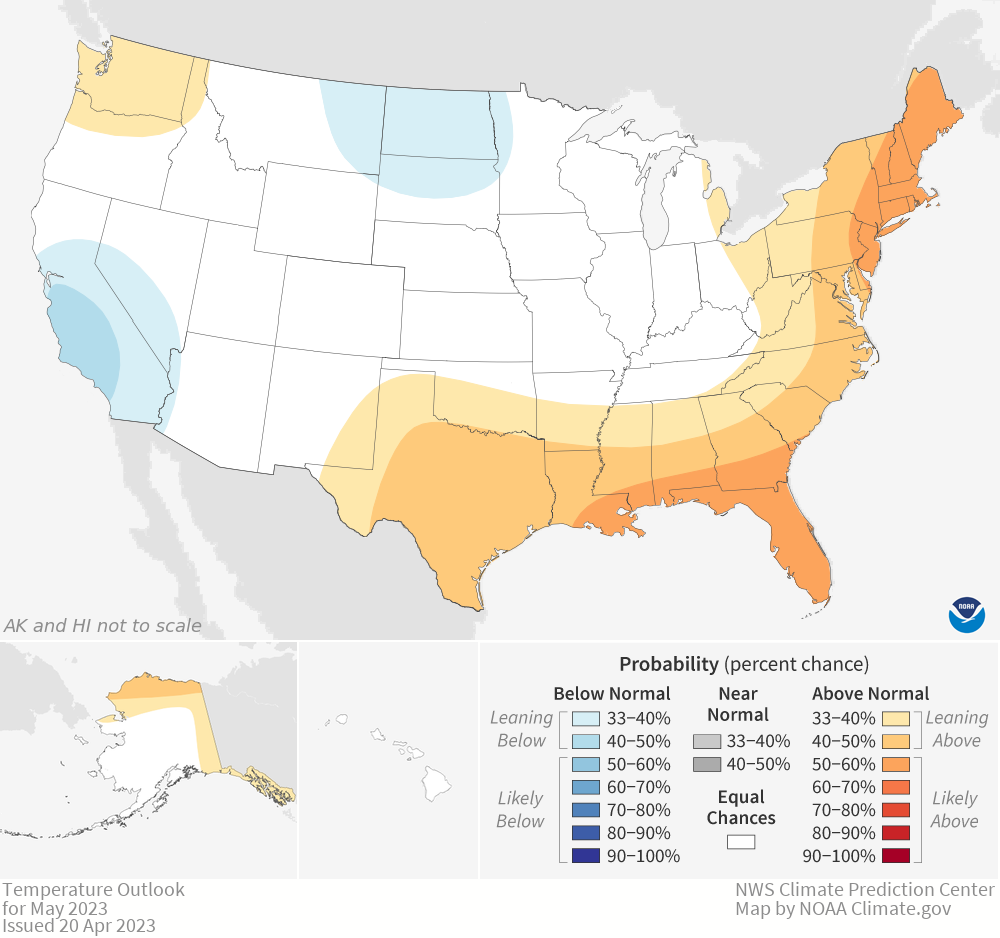
In general, many of the changes from the April 20th release tilt toward a cooler May across most of the country, except for in the Pacific Northwest and the Northern Plains. While most of the East originally had above normal temperatures favored, the revised outlook only favors above-average temperatures in New England and Florida, with the outlook for the central Appalachians now slightly favoring below-normal temperatures.
Despite a colder than average start to May in much of the East, longer term outlooks as well as the Madden Julian Oscillation favor a transition to above average temperatures later in the month, particularly in New England. Shorter- (Week 1 and 2) and longer-range (Week 3 and 4) outlooks are more consistent out West, with above average temperatures favored in the North and below-average in the South.
Precipitation outlook
The precipitation outlook for May has elevated probabilities for above-average precipitation in much of the West and along the Gulf Coast from central Texas to Florida, and elevated probabilities for below-average precipitation in the middle of the country, from the Dakotas eastward to Ohio and southward to the Tennessee Valley. The highest likelihood (50-60%) is over central and northern California, where odds for above-average precipitation occur in both the shorter- and longer-term outlooks.
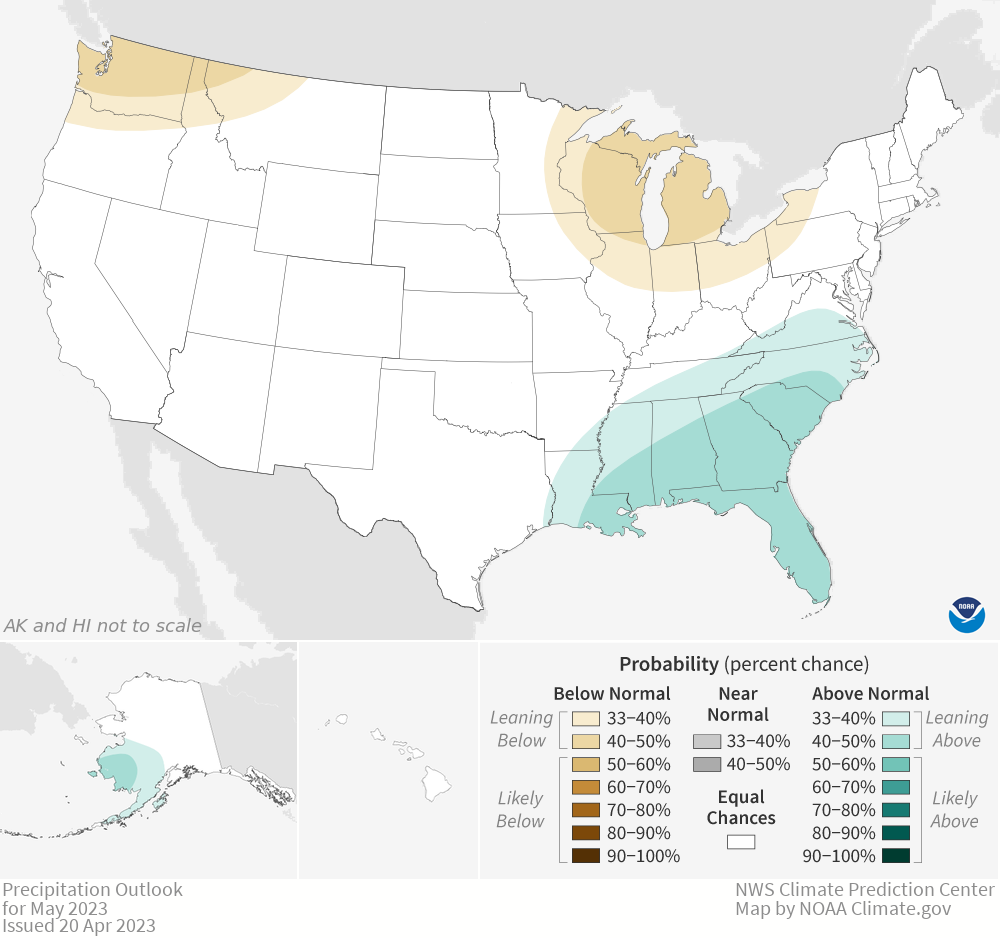
The updated precipitation forecast is somewhat consistent with the earlier monthly release across the eastern half of the contiguous United States, although the region favoring above-average precipitation has shifted a bit south and also west into Texas. Also, enhanced probabilities of below normal precipitation over the Great Lakes in the mid-month Outlook were expanded into the Upper and Middle Mississippi, Ohio, and Tennessee Valley regions in the updated outlook. More significant changes occurred out west, with the outlook now favoring above-average precipitation in California, Nevada, Oregon, Idaho and no longer favoring below-average precipitation in the northern part of the Pacific Northwest.
Drought monitor
As of April 25, 2023, 25.5% of the contiguous U. S. was in drought, with only 6% in the two worst categories (D3-D4). This is an improvement of about 5% in the area affected by drought in the past month and over 30% since the beginning of the winter. The decrease in areas impacted by the two worst categories of drought was about 8% since the beginning of winter, but has generally held steady for the past 2-3 months.
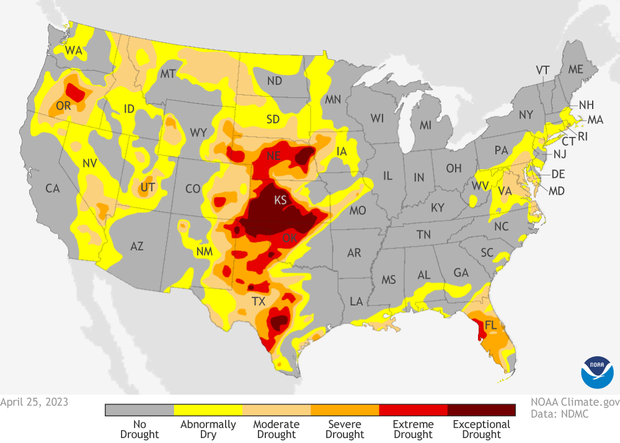
Drought conditions across the United States as of April 25, 2023. NOAA Climate.gov map, based on data from the U.S. Drought Monitor Project. See more drought maps at Drought.gov.
In the last month, drought has improved significantly in southern Texas (up to a 3-4 class improvement) and also in much of the West, the northern Plains, eastern North Carolina, and south Texas. However, drought has developed or worsened in the central Plains and developed in the mid-Atlantic.
Drought outlook
For May, drought is likely to improve in the mid-Atlantic (with drought removal likely), over Florida, and in parts of the southern Plains, where drought is likely to remain despite some improvement. In contrast, drought is expected to persist in other drought areas of the central and western U. S. and even develop in northeastern Kansas, northern Missouri, and southern Iowa.
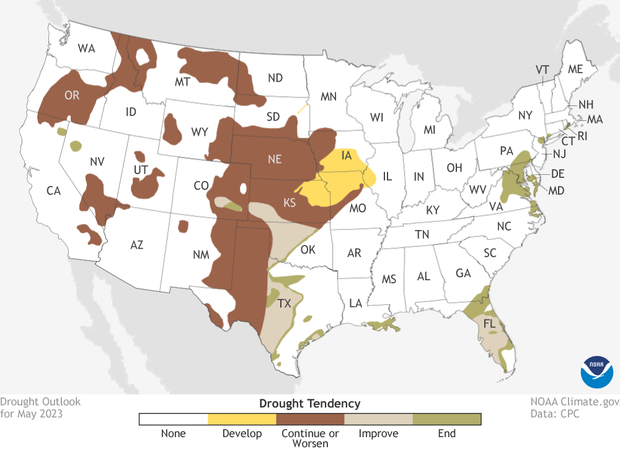
Projected changes in drought across the contiguous United States in May 2023. NOAA Climate.gov map, based on data from the Climate Prediction Center.
A little more math
NOAA’s monthly and seasonal forecasts start with the assumption that for any random month or season, there are three possible temperature or precipitation outcomes: well above normal (upper third of the climatological record), near normal (middle third), or well below normal (lower third). Each outcome is initially assumed to be equally likely. Together, all probabilities must add up to 100%, so the “default” probability for each outcome is 33.3%.
The goal of the forecast is to estimate how the actual conditions in the weeks or months before the season—like the presence of El Niño—tilt the odds toward or away from “equal chances” for all categories. If models predict that the chances of well above average temperatures are 60%, then the chances for the other two outcomes (near-average and well below average temperatures) must be split between the remaining 40% (100-60=40).
How do we divvy up the remaining fraction? Physically speaking, it makes sense to say that if the odds have tilted toward one climate outcome (say, unusual warmth) by a given amount, they’ve tilted away from the opposite outcome by an equal amount. So, by convention, forecasters divvy up the remaining fraction by holding the chances for near-normal conditions at the “default” 33.3%, and subtracting it from the remainder. What’s left (40-33.3=6.7%) is the probability of the least-favored category.
When the odds of one climate outcome are so high (70 percent or more) that the remaining fraction is smaller than 33.3 percent, forecasters set a minimum 3.3 percent chance for the opposite outcome, and give the larger portion of the remainder to the near-normal outcome. (Otherwise, the least favored category would wind up with a negative probability, which doesn’t make mathematical or physical sense.) The Climate Prediction Center has a chart showing all the possible combinations, and their own description of the forecast format.
Since only one color can be assigned to any location on the map, the most favored category decides the color, but the other categories are still possible. So, where the May temperature outlook map shows a 50-60 percent chance of well above average temperatures for parts of Idaho and Washington, the full picture is that there is a 50-60% chance of well above normal temperatures, a 33.3% chance of near-normal temperatures, and 6.7-16.7% chance of well below normal temperatures.
To read the entire discussion of the monthly climate outlooks from the Climate Prediction Center, check out their website.