U.S. climate outlook for November 2023
November marks the end of fall, and at times can be a harbinger of the winter ahead. Will we see an early onset of winter across parts of the United States this year, or do we expect a continuation of the rather benign weather we’ve seen during October? And as Halloween has just passed, I’d be remiss if I didn’t ask if the outlooks had some treats or tricks in store for the country. Here’s the outlook from NOAA's Climate Prediction Center (CPC).
The U.S. temperature outlook for November 2023 showing places where a much warmer than average August is favored (orange to red) and where a much cooler than average November is favored (light to dark blues). White areas indicate that there are equal chances for a warm, cool, or near-average November. For more details on how to interpret these maps, read our explainer Understanding NOAA's monthly climate outlooks. NOAA Climate Prediction Center.
On October 31, CPC released its updated monthly climate outlooks for temperature, precipitation, and drought across the United States for November 2023. The temperature outlook favors well above normal temperatures across the western half of the nation and in the deep South, while slightly favoring well below average temperatures in New England. The precipitation outlook favors well above average precipitation (rain and/or snow) in the Pacific Northwest and in Florida and southern Georgia, with well below average precipitation favored from the Tennessee Valley northward to the Ohio Valley and around the Great Lakes.
The U.S. precipitation outlook for November 2023, showing places where a much wetter than average November is favored (green) and where a much drier than average November is favored (brown). White areas indicate that there are equal chances for a wet, dry, or near-average November. For more details on how to interpret these maps, read our explainer Understanding NOAA's monthly climate outlooks. Climate Prediction Center map.
Below, I’ll discuss the rational behind the CPC outlooks as well as provide additional information about them. I’ll also discuss the current state of drought, how it changed during October, and the drought outlook for November. Finally, remember that the colors on the temperature and precipitation outlook maps only provide information about the most likely outcome—we have to pick a color!— but other outcomes are always possible, just less likely to occur. More details about interpreting the outlooks can be found here.
The updated outlooks were produced considering the Week 1 forecast from the Weather Prediction Center (WPC), and CPC’s own Week 2 and Week 3-4 outlooks. Other tools that forecasters considered this month were various longer-range forecast models such as the Global Ensemble Forecast System (GEFS), the Climate Forecast System (CFSv2), and products derived from these models. El Niño continues to strengthen across the tropical Pacific and was considered as the dominant teleconnection for the outlooks during November. Another factor forecasters considered was the predominance of above-average sea surface temperatures (SSTs) along most of the U.S. coastlines.
Temperature outlook
The November temperature outlook favors well above average temperatures across the western half of the country and across the Gulf Coast States. Well below normal temperatures are only favored over New England, with equal chances of above-, near-, or below-normal temperatures favored elsewhere. The highest odds for a warmer-than-average November cover much of the Western U.S., where probabilities exceed 50%. In contrast, the likelihood of below-average temperatures in New England is quite modest (only 33-40%), indicating lower confidence in the indicated outcome.
Persistent ridging—when the jet stream bulges northward around an area of high pressure— and above-average temperatures over the western U.S. are predicted in early to mid-November, and the longer-range Week 3-4 outlook favors above-average temperatures throughout the Southwest. Above-average SSTs along the entire West Coast also slightly support a tilt toward above-average temperatures, as the air can pick up warmth from the water and carry it “downstream” over the country.
In contrast, much of the East is expected to be colder than average during the first half of the month, but uncertainty among the models for later in the month over much of this region results in an “equal chance” forecast for most of it. Models and tools are in somewhat better agreement that the below-average temperatures will persist in New England.
Precipitation outlook
Below-average precipitation during November is favored across parts of the lower and middle Mississippi, and Tennessee and Ohio Valleys. The odds of drier-than-normal conditions are, however, quite modest, with maximum probabilities in this region less than 50%. This outlook is consistent with the El Niño teleconnection, as well recent CFSv2 monthly forecasts. Some model forecasts also favor below-normal precipitation across much of the East Coast, but above-average precipitation is favored during the early part of the month, so this region has no tilt in the odds towards any of the 3 possible outcomes.
In contrast, above-normal precipitation is favored across the Pacific Northwest, with probabilities exceeding 50% in much of Oregon and Washington. Above-average precipitation is favored during all time periods (6-10, 8-14, and weeks 3-4) leading to the higher confidence forecast. In addition, there is a very weak tilt (33-40%) toward above-average precipitation over coastal parts of the Southeast due to the previously noted El Niño teleconnection.
Drought outlook
During October, the amount of drought across the United States increased, with the percent of the contiguous U.S. in drought increasing from 38% at the end of September to around 40% by the end of October. However, the percent of the country in the two most intense categories (D3-D4, representing extreme and exceptional drought) decreased slightly, from about 10% to 9%.
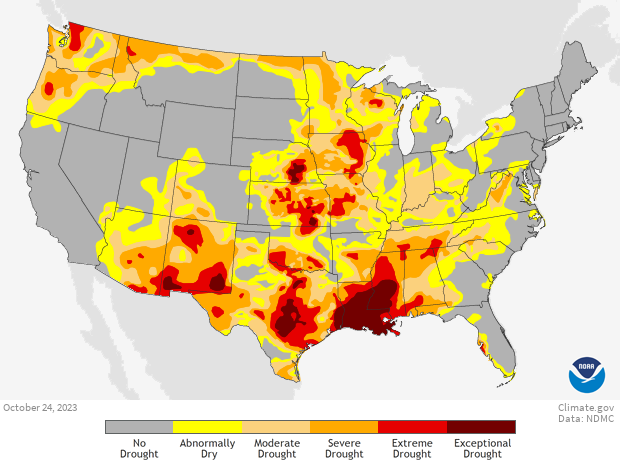
Drought conditions across the contiguous United States as of October 24, 2023. Extreme (red) and exceptional (dark red) drought was confined to the heart of the Great Plains and parts of Texas. NOAA Climate.gov map, based on data from the U.S. Drought Monitor Project. For more details on drought, visit Drought.gov.
Much of the drought expansion and degradation occurred across the Southeast, as drought developed and rapidly intensified throughout the Tennessee Valley and southern Appalachians. Changes of 3-4 classes in this area resulted in regions beginning the month not in drought, but ending it in extreme drought. Drought across other parts of the South exhibited smaller changes, although parts of southern and eastern Texas did experience 2-3 class improvements. Across the northern U.S., some minimal drought improvement was observed (1-2 classes), but with much of this region remaining in moderate to severe drought. Improvements of 1-2 classes were also observed in the Ohio Valley, with drought removal found in northern Indiana and Ohio.
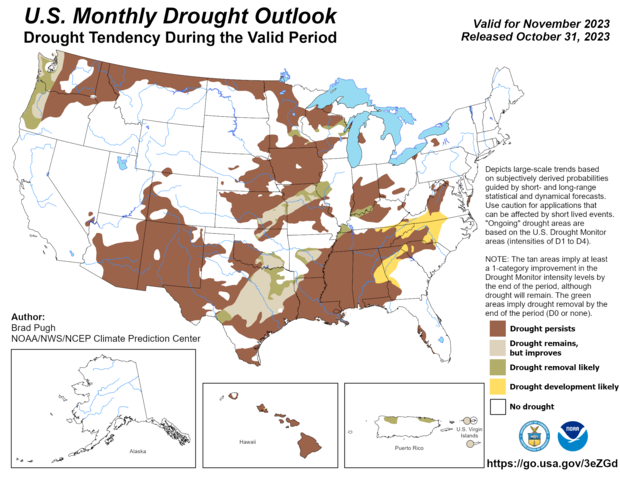
The November 2023 drought outlook for the United States. Yellow areas are likely to see drought develop. Brown areas are likely to see drought persist. Tan means drought is likely to improve at least 1 category, and green means drought is likely to end. NOAA Climate Prediction Center.
For November, the main story is the likely persistence of drought across much of those regions already in drought, as November is a relatively dry time of the year across those regions. Drought improvement or removal is likely along the Pacific Northwest coast, as the monthly outlook and climatology (the fact that November is a wet month for the area) both support this outcome. Improvement is also likely across parts of the Southern and Central Great Plains and Midwest, largely due to heavy rainfall that fell at the end of October. Drought development is favored for parts of the Southeast early in November, but the duration of this drought is uncertain and could be short-lived.
To read the entire discussion of the monthly climate outlooks from the Climate Prediction Center, check out their website.