U.S. climate summary for February 2022
According to the February 2022 climate summary from NOAA National Centers for Environmental Information, the month was slightly cooler than average for the contiguous United States. The national average temperature was 33.8 degrees Fahrenheit (˚F) for the Lower 48 U.S. states, which 0.1 °F below the 20th-century average. That ranks in the middle third of the 128-year period of record. In Alaska, the temperature was warmer than average but not exceptionally so; it was 3.8 ˚F warmer than average, which ranks in the middle third of Februarys in the state’s 86-year historical record.
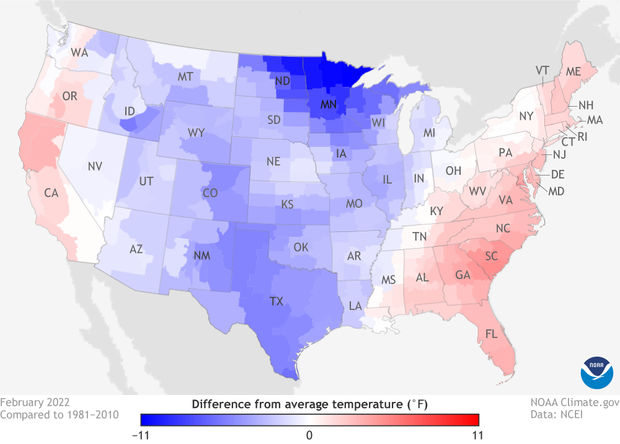
Temperatures across Lower 48 U.S. states in February 2022 compared to the 1981-2010 average. Places that were cooler than average are blue; places that were warmer than average are red. NOAA Climate.gov image from Data Snapshots, based on data from NOAA National Centers for Environmental Information.
As the map above shows, the tilt toward cooler-than-average temperatures was driven by a wide vertical swath of cool conditions in the country’s midsection, with parts of the Northern Plains, Colorado, New Mexico, and Texas experiencing much cooler than average temperatures. This cool anomaly was sandwiched between warmer-than-average temperatures to the west and east along the coasts, with much warmer than average conditions in parts of California, the Southeast, and a bit of Maine.
Despite a significant winter storm that walloped the Plains and much of the East in early February with heavy snow and freezing rain, February overall was drier than average. Total precipitation for the contiguous United States, according to the report,
was 1.73 inches, 0.40 inch below average, and ranked in the driest third of the historical period of record. The winter precipitation total was 5.76 inches, 1.03 inches below average, and ranked as the 12th-driest winter in the 127-year period of record.
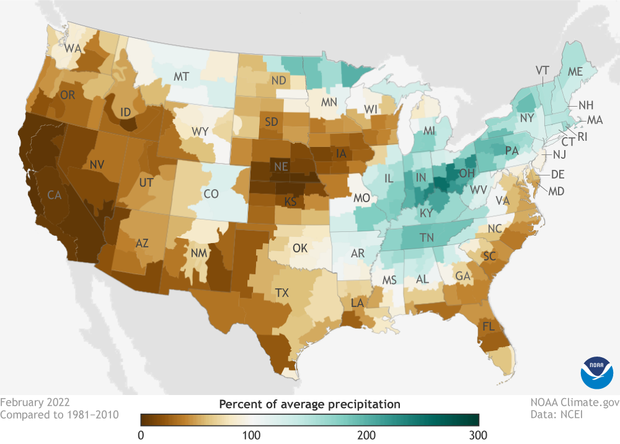
Precipitation across Lower 48 U.S. states in February 2022 compared to the 1981-2010 average. Places that received less than 100 percent of their average February precipitation are colored brown. Places that received 200 percent or more of their average precipitation are colored greenish blue. NOAA Climate.gov image from Data Snapshots, based on data from NOAA National Centers for Environmental Information.
The report continued,
Precipitation was above average from the Mid-Mississippi Valley to New England. Ohio had its sixth-wettest February. Precipitation was below average across most of the West and portions of the Plains, Southeast and Mid-Atlantic. California and Nebraska had their second-driest February with Nevada ranking third driest.
Alaska, meanwhile, had its wettest February on record, and snowpack was above average across most of the state.
As far as drought conditions go, the final month of meteorological winter was a bust for much of the West. On March 1, the U.S. Drought Monitor project estimated that the U.S. area facing some level of drought had increased to nearly 60 percent.
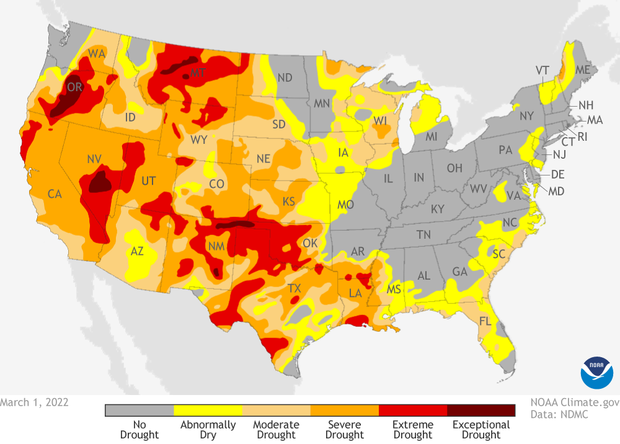
Drought conditions across the contiguous United States as of March 1, 2022. Drought intensity is shown by colors ranging from yellow (abnormally dry) to dark red (exceptional drought). NOAA Climate.gov map from Data Snapshots, based on data from NOAA National Centers for Environmental Information.
Drought conditions expanded or intensified across portions of the northern and central Plains, as well as across parts of the West, Midwest, Great Lakes and from Florida to the Carolina coast. Drought contracted on the Big Island of Hawaii, but expanded across the islands of Kauai and O’ahu. Drought severity lessened across portions of the southern Plains and across Puerto Rico.
For more details on February climate, including extreme events, sea ice conditions, as well as the end-of-winter recap, see NOAA National Centers for Environmental Information’s summary Assessing the U.S. climate in February 2022. The global report for February will be released next week.