U.S. climate summary for October 2022
NOAA National Centers for Environmental Information released the agency’s October 2022 climate summary this week. Below are some highlights.
Drought
On October 13, the U.S. Drought Monitor (USDM) revealed nearly 82% of the continental U.S. to be abnormally dry or in drought, the largest area affected in the history of the USDM, which launched in 2000. According to the November 1 U.S. Drought Monitor report, about 62.8% of the CONUS was in drought, up about 11.9% from the end of September.
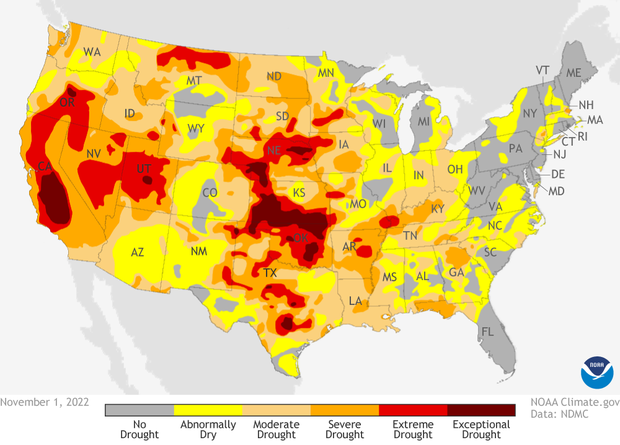
Much of the contiguous United States was either abnormally dry (yellow) or in drought (light orange to dark red colors) as of November 1, 2022. Climate.gov map from Data Snapshots, based on data from the U.S. Drought Monitor project. For more information, visit Drought.gov.
The lowest water levels in the Mississippi River in a decade, caused by a severe Midwest drought, restricted access to the vital channel to barge traffic at a crucial time of the year for the transport of crops from the nation’s heartland.
Temperature
The average temperature of the contiguous U.S. in October was 55.3 °Fahrenheit, which is 1.2 °F above average, ranking in the warmest third of the record. Generally temperatures were above average in New England and from parts of the central and northern Plains to the West Coast.
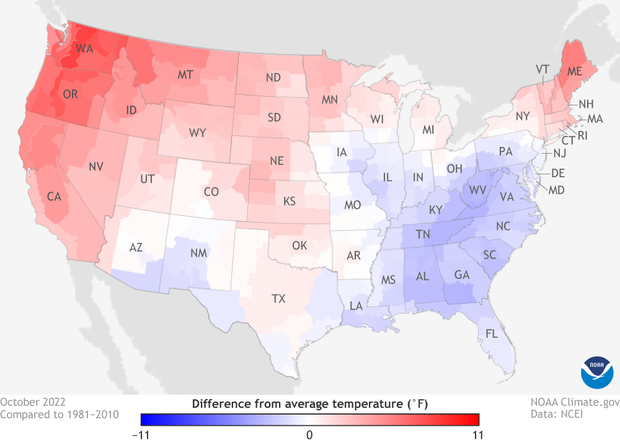
Map of the contiguous United States showing where temperatures in October 2022 were warmer than the 1991-2020 average (red) or cooler than average (blue). (View Alaska.) Climate.gov map from Data Snapshots, based on data from NOAA National Centers for Environmental Information.
The Alaska statewide October temperature was 28.8 °F, 3.3 °F above the long-term average. This ranked in the warmest third of the 98-year period of record for the state.
Precipitation
October precipitation for the contiguous U.S. was 1.66 inches, 0.50 inch below average, ranking in the driest third of the historical record. Precipitation was above average in Montana and across parts of the Northeast and Southwest and below average across portions of the West, central and northern Plains, Midwest and Southeast.
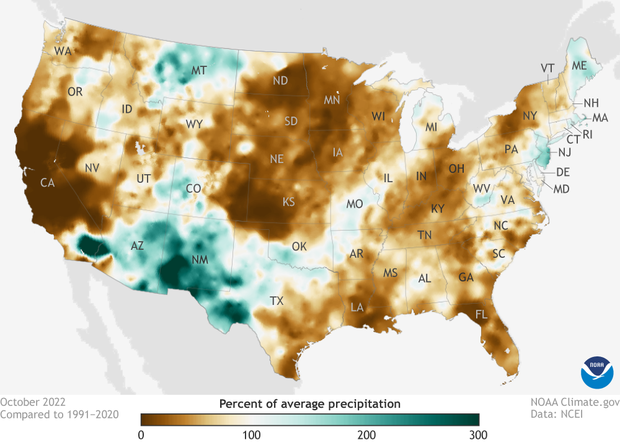
Precipitation in October 2022 compared to the 1991-2020 average, with places that were drier than average colored brown and places that were wetter than average colored blue-green). (View Alaska.) Climate.gov map from Data Snapshots, based on data from NOAA National Centers for Environmental Information.
More information
- U.S. climate summary for October 2022 from NOAA NCEI
- October 2022 full monthly report (released November 14)
- November 2022 U.S. climate outlook