U.S. Spring Outlook 2022: Drought to expand amid warmer conditions
NOAA issued its U.S. Spring Outlook today and for the second year in a row, forecasters predict prolonged, persistent drought in the West where below-average precipitation is most likely. NOAA’s Climate Prediction Center—part of the National Weather Service—is also forecasting above-average temperatures for most of the U.S. from the Desert Southwest to the East Coast and north through the Midwest to the Canadian border from April to June.
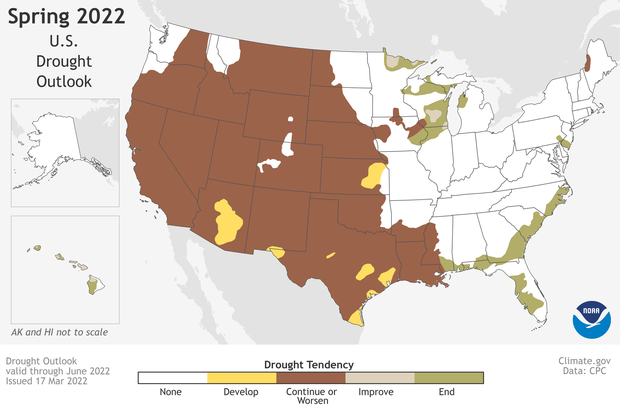
According to the spring drought outlook, the long-running drought across the U.S. West is likely to continue or worsen through June (dark brown areas). Of the few places in the West not already in drought, drought is likely to develop (yellow). Drought in the Great Lakes region and Southeast is likely to improve (light brown) or end (green). Map by NOAA Climate.gov, based on data from the Climate Prediction Center.
“NOAA’s Spring Outlook helps build a more weather and climate ready nation by informing local decision makers and emergency managers of this spring’s hazardous weather, such as extreme drought,” said NOAA Administrator Rick Spinrad, Ph.D. “NOAA’s seasonal outlooks provide advanced warning of the conditions to come, enabling communities to make preparations that boost their resilience to these hazards.”
Spring Outlook for drought, temperature, and precipitation
“Severe to exceptional drought has persisted in some areas of the West since the summer of 2020 and drought has expanded to the southern Plains and Lower Mississippi Valley,” said Jon Gottschalck, chief, Operational Prediction Branch, NOAA’s Climate Prediction Center. “With nearly 60% of the continental U.S. experiencing minor to exceptional drought conditions, this is the largest drought coverage we’ve seen in the U.S. since 2013.”
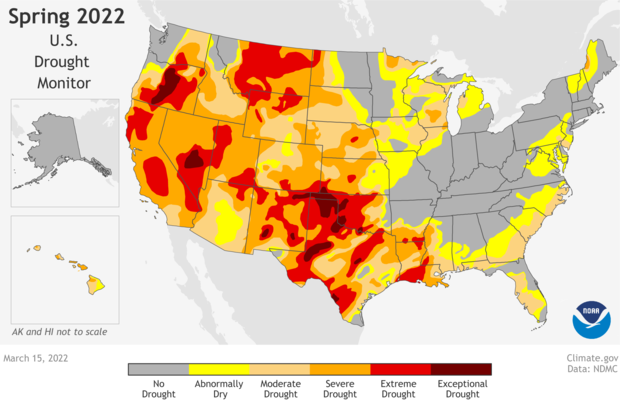
Drought conditions across the United States as of March 15, 2022. Virtually the entire West was experiencing some level of drought, much of it severe (dark orange), extreme (red). or exceptional (dark red). NOAA Climate.gov image, based on data from the National Drought Mitigation Center.
Short-term drought recently developed in a region stretching from North Carolina southward through parts of Florida. Dry conditions will bring an elevated risk of wildfires across the Southwest and southern Plains and north to the Central Plains, especially when high winds are present. Drought conditions in the Southwest are unlikely to improve until the late summer monsoon rainfall begins.
More than half of the U.S. is predicted to experience above-average temperatures this spring, with the greatest chances in the Southern Rockies and Southern Plains. Below-average temperatures are most likely in the Pacific Northwest and southeast Alaska.
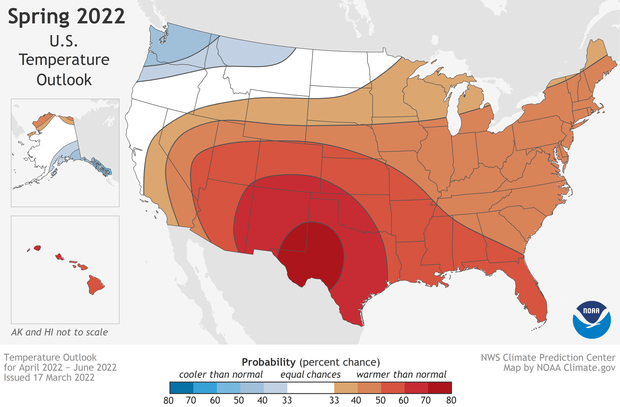
Map of the temperature outlook for the United States for April–June 2022, showing which locations have the highest chances for a much warmer (red) or much cooler (blue) than average spring. Darker colors mean higher chances, not more extreme temperatures. White does not mean average temperatures are forecast; it means that all three possible temperature outcomes (below normal, near normal, and above normal) are equally likely. NOAA Climate.gov maps, based on data from the Climate Prediction Center.
Above-average precipitation is most likely in portions of the Great Lakes, Ohio Valley, mid-Atlantic and the west coast of Alaska, while below-average precipitation is forecast for portions of the Central Great Basin, Southwest, Central and Southern Rockies and Central and Southern Plains, eastward to the Central Gulf Coast.
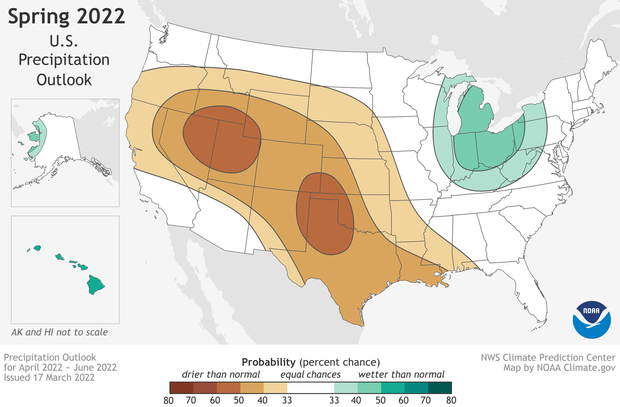
Map of the precipitation outlook for the United States for April–June 2022, showing which locations have the highest chances for a much wetter (blue-green) or much drier (brown) than average spring. Darker colors mean higher chances, not bigger differences from normal precipitation. White does not mean average precipitation; it means that all three possible precipitation outcomes (below normal, near normal, and above normal) are equally likely. NOAA Climate.gov maps, based on data from the Climate Prediction Center.
Spring flood risk
There is a minor-to-moderate flood risk throughout much of the eastern half of continental U.S., including the Southeast, Tennessee Valley, lower Mississippi Valley, Ohio Valley, and portions of the Great Lakes, upper Mississippi Valley, and middle Mississippi Valley. An above-normal ice breakup and flood potential is also present in Alaska.
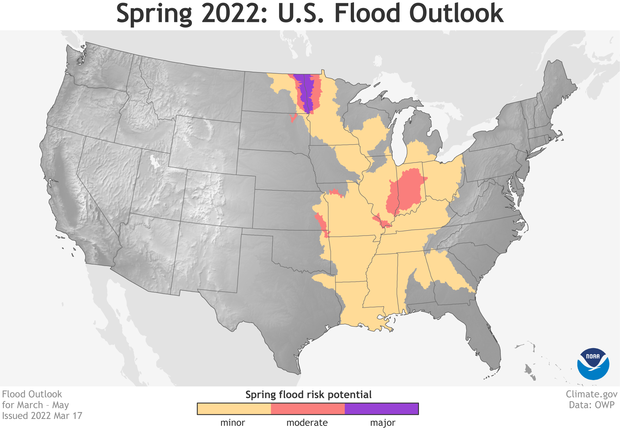
Map showing parts of the United States with at least a 50 percent chance of minor (yellow), moderate (red), or major (purple) floods in March–May 2022. The risk of major flooding is confined to the northernmost Great Plains. Map by NOAA Climate.gov, based on data provided by the Office of Water Prediction.
“Due to late fall and winter precipitation, which saturated soils and increased streamflows, major flood risk potential is expected for the Red River of the North in North Dakota and James River in South Dakota,” said Ed Clark, director, NOAA’s National Water Center.
Spring snowmelt in the western U.S. is unlikely to cause flooding.
NOAA’s National Hydrologic Assessment evaluates a number of factors, including current conditions of snowpack, drought, soil saturation levels, frost depth, streamflow and precipitation.
About NOAA Outlooks
NOAA produces seasonal outlooks to help communities prepare for weather and environmental conditions that are likely during the coming months to minimize impacts on lives and livelihoods. Heavy rainfall at any time can lead to flooding, even in areas where the overall risk is considered low. Rainfall intensity and location can only be accurately forecast days in the future, therefore flood risk can change rapidly. Stay current with flood risk in your area with the latest official watches and warnings at weather.gov. For detailed hydrological conditions and forecasts, go to water.weather.gov.
Media contact
Jasmine Blackwell, (202) 841-9184