Tools & Interactives
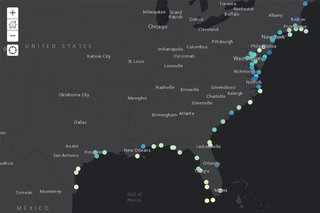
Predicted number of high tide flooding days in 2018 for almost 100 locations along the East and West Coast of the United States, the Caribbean, and Pacific Ocean.
View this tool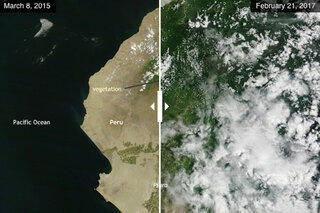
Compare the before and after images of heavy rains and floods in Peru in February 2017. The pale tan of the normally semi-arid coastal landscape is transformed by the green-up of vegetation.
View this tool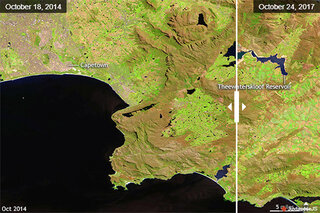
Compare before and after infrared-enhanced satellite images to see the impact three years of below-average rain has had on reservoirs around Cape Town, South Africa. Water levels have drastically fallen.
View this tool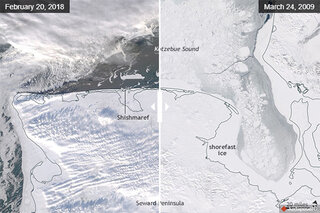
Compare the extent of Bering Strait shorefast ice in 2018 to more typical conditions. Shorefast ice is necessary for subsistence hunting and fishing, and offers protection from dangerous ice debris being driven onshore.
View this tool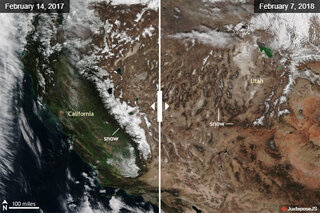
Grab and drag the slider to compare Suomi VIIRS satellite images of the snowpack across the western United States in 2017 and 2018. Snow levels in 2018 were below average and much lower than 2017.
View this tool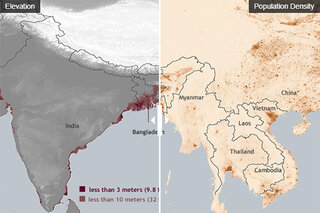
Grab and drag the slider to compare elevation and population density images for countries around the Bay of Bengal to understand the significant risk they face from cyclones.
View this tool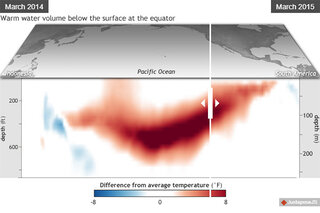
Compare subsurface waters in spring 2014 and 2015. Despite the similarities, 2014's impressive warm anomaly failed to evolve into El Niño, while 2015's slightly smaller anomaly did.
View this tool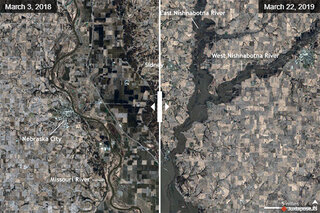
Compare March 3, 2018 to March 22, 2019 to see the extent of farmland flooding near Nebraska City, Nebraska, as rain and snowmelt swelled the Missouri River during a billion-dollar disaster event.
View this tool