Climate & construction
The construction industry loses billions of dollars on delays and failures caused by bad weather. Buildings are damaged during storms; sites turn into seas of mud; freezing temperatures make it impossible to pour concrete. It would seem to make sense for construction planners to use seasonal forecasts to minimize the risk of these unpleasant, expensive surprises.
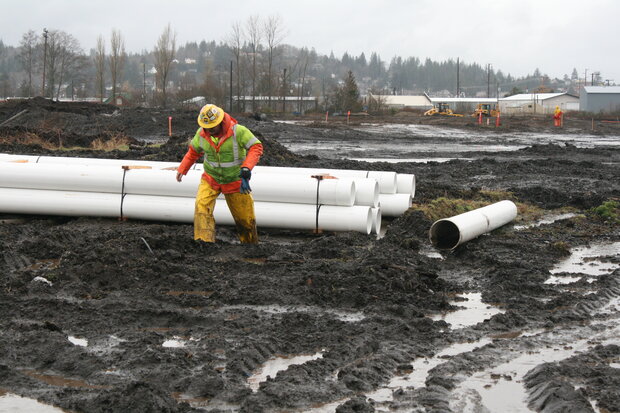
Crews de-watering a site in Aberdeen, WA. Taken on March 9, 2011. Photo by Washington State Department of Transportation, used via a CC license.
After all, farmers consult long-term outlooks when buying crop insurance and planning when to sell their crops. But the trend has not caught on among builders. Real estate industry risk expert Guillermo “Willy” Accame aims to change that.
“When we have NOAA seasonal forecasts available to us,” says Accame, “why chalk up weather-related risks to unquantifiable ‘force majeure’?” Without the use of forward looking science, the construction industry’s planning culture is what Accame describes as “throwing spaghetti against the wall and seeing what sticks.” The standard practice is to plan by looking back at past weather. But we know that climate phenomena, even predictable ones such as El Niño, can drive seasonal conditions very different from the historical average.
Accame is the Director of Risk Management at Panattoni Development, a company that, with 24 offices and employees nationwide, is one of the largest developers of warehouses and logistics facilities in the United States. “Contractors’ profit margins are low,” he says, “so careful planning is essential. When it comes to planning for bad weather, we’re actually in the risk management business.” To help with that planning, he figures, some science would be better than none.
Prototype Climate-i Developed in Boulder
So Accame, who lives in Denver, Colorado, tapped into the world-class expertise next door at the Boulder-based National Center for Atmospheric Research (NCAR) to develop a prototype web tool, Climate-i Construction, a science-based tool that applies seasonal outlook data to construction risks.
The tool’s developers include extreme weather experts and data scientists with the Capacity Center for Climate & Weather Extremes at NCAR, advisors from NOAA, and representatives from the construction, insurance, and real estate finance business. Climate-i Construction will allow users to put in the time and place of a construction job, and set thresholds for parameters that matter for the building trade, like temperature, precipitation and wind. The tool will then provide tailored predictions about the probability of conditions falling above or below the thresholds—too cold to pour concrete, too wet to excavate, too windy to operate a tower crane.
Accame explained how the tool might work for a construction manager in Chicago planning to build a new warehouse. The manager queries the Climate-i tool, saying the construction will take place between February 15 and September 15. The project could have down days, or the construction company will need to take adaptive measures, if there are more than 1.5 inches of rain in a day, if the temperature is above 95 or below 25 degrees, or if sustained wind speed exceeds 20 MPH.
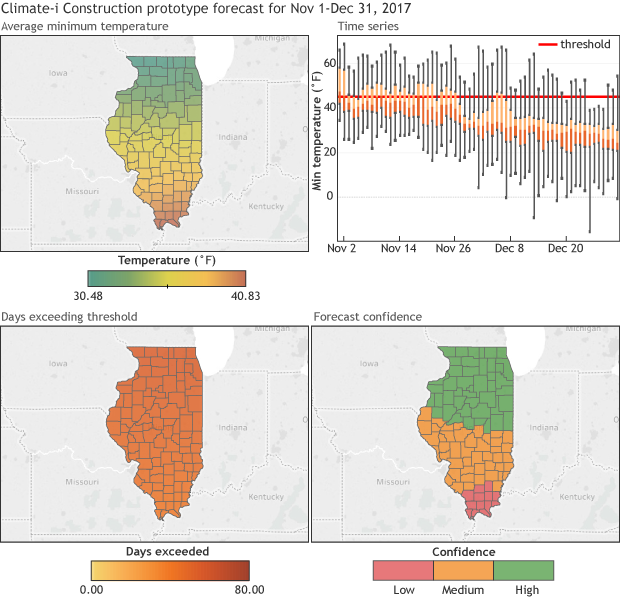
A screen shot from the prototype Climate-i app, showing some of the forecast information the tool would provide for the coming November-December period in Illinois: (top left) the average minimum temperature in a given area, (top right) daily temperatures relative to a user-set threshold, (bottom left) the number of days during the period on which the threshold temperature is exceeded, and (bottom right) the level of confidence (uncertainty) in the forecasts for different parts of the state.
Drawing on the ensemble of seasonal forecasts provided by NOAA’s Climate Forecasting System Version 2 model, the tool calculates the most likely number of days that will exceed these specified temperature, precipitation and wind thresholds. The tool also uses the forecast range to provide an assessment of whether the forecasts have high, medium or low confidence.
The construction manager can revisit the program throughout the construction period to query the latest forecasts for periods of work activities sensitive to specific weather. Armed with this information, an insurance brokerage and risk management company such as Willis Towers Watson can use the tool’s readout to inform the risk coverage they will offer to the new building’s owner.
Skeptics and enthusiasts
Some construction executives are skeptical about whether science can make their lives simpler. “We build buildings in terrible weather all the time,” says Paul Little, CEO at construction giant Alston who has seen the new tool. “We consider ourselves lucky if the weather is not terrible.”
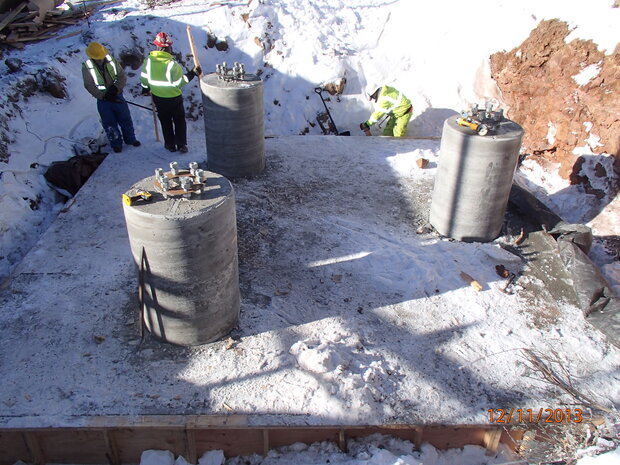
Crew members remove the forms from the concrete foundation for a new 80 foot tower at Aldrich Mountain in Grant County, Oregon, on December 11, 2013. Builders can only pour concrete between a given range of temperature and moisture conditions, and figuring out how many days in a given period are likely to meet those requirements might help project managers and insurers reduce the risk of costly delays. Photo by Oregon Department of Transportation, used under a CC license.
Though Alston regularly uses two-week outlooks from the National Weather Service to schedule work such as concrete pours, Little, who has been in the industry for more than four decades, said long-term forecasts would have to be far more accurate than they are now to be of greater use—though he confessed that he only discovered recently how good NOAA’s three-month outlooks have become.
Others are more enthusiastic about the possibilities of the new tool. Jeff Burns, an executive at Willis Towers Watson, the insurance brokerage and risk management firm, loves the idea that the Climate-i tool can generate data for construction sites. “More data points on weather and buildings supports better risk-taking,” Burns says. “And better risk-taking should lead to lower finance and insurance costs.” Currently, insurance firms have only the past to guide them, even going so far as to scour old ship captains logs for data points.
Burns, who is on Climate-i’s advisory committee, lays the numbers bare: a day of lost productivity on a $200 million construction project might cost an owner up to $250,000 in labor, leased equipment, and contractual penalties. With a 10% profit margin yielding just $20 million, that single day of lost productivity could significantly impact profit and loss. He predicts that data tied to a building’s location will add value not only to guide construction planning but also to track and improve how well buildings withstand conditions over their lifetime.
So the tool’s best customers may turn out to be not contractors, but the insurance and risk management firms who sell the builders insurance policies that provide a financial cushion against disaster.
Location, location, location
Claire Wilkinson, Managing Director of the Risk & Analytics division of Willis and a colleague of Burns, oversees design of the insurance products that industries — energy, agriculture, construction, retail—buy to offset risk. For her, the value of the Climate-i tool is obvious. In fact, Willis is building a similar index that can be used in several industries.
Wilkinson says for now Willis only uses historical climate data sets in designing risk management products, not forecasting. They look back to datasets spanning decades, and use techniques to make sure data represent current conditions, such as, say, increases in extreme weather.
Wilkinson says the more the Climate-i tool can accurately reflect site geography and provide records comparing the forecast to actual conditions at a site, the better markets can price the risk and help construction managers manage those risks, and the more value the tool will bring.
Testing the prototype
The Climate-i prototype still has some big hurdles to jump, as scientist James Done of NCAR’s Climate and Weather Extremes center explains: first, the team aims to test performance against “hindcasts,” in which the models would be asked to run forecasts for time periods that have already happened to test for accuracy. And they are still working, with the help of data scientists, on technology to rapidly query the vast and ever-changing NOAA databases. In the meantime, scientists on the team are focused on forecast skill.
As the Climate-i tool evolves from idea to reality, construction and development industry visionaries like Accame see it helping to move a giant industry out of the “see if the spaghetti sticks to the wall” era and into a data-driven world where the chance of damaging rain, wind, or heat can be priced into a contract using the best available science. The industry has been stuck, as Alston’s Little observes, in the “same old, same old” way of predicting risk for a long time. Maybe it’s time for a change.