2022 Global temperature recap
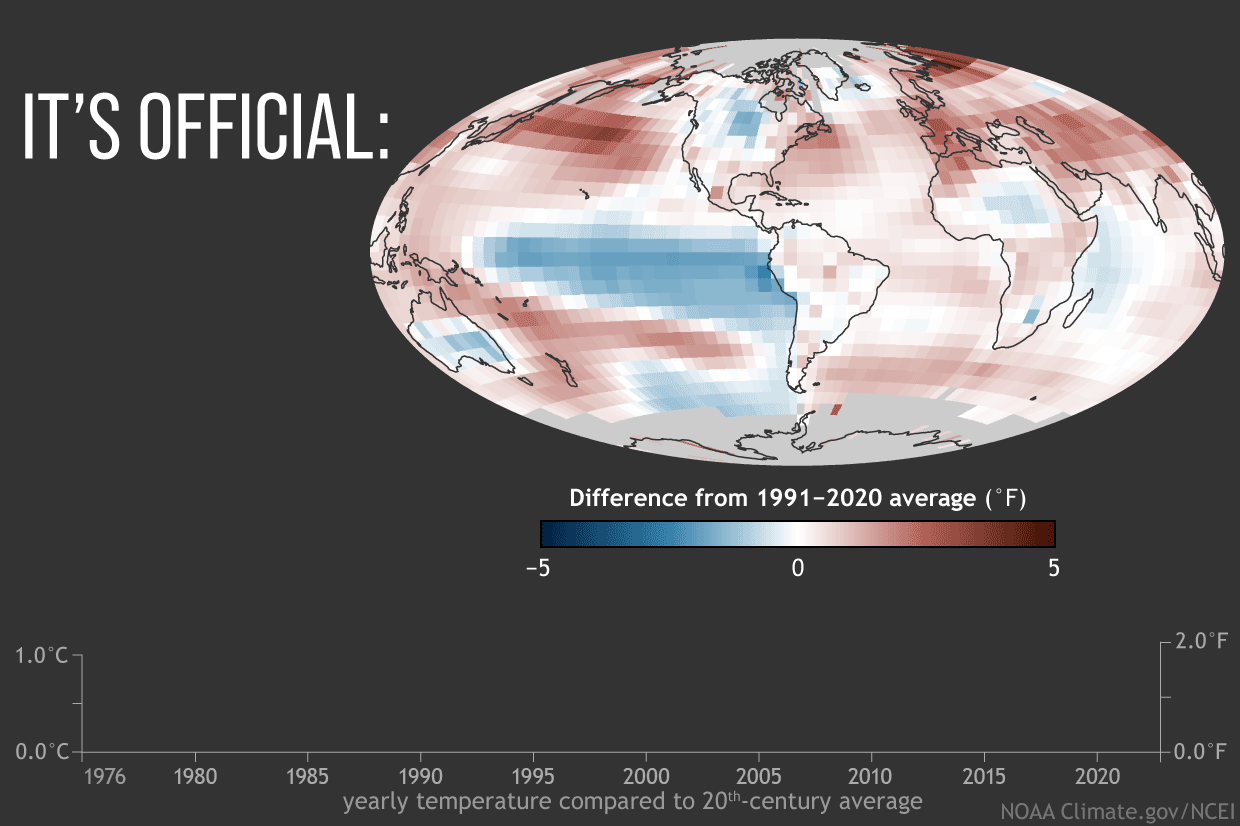
(map) Global average surface temperature in 2022 compared to the 1991-2020 average, with places that were warmer than average colored red, and places that were cooler than average colored blue. (graph) The bars on the graph show global temperatures compared to the 20th-century average each year from 2022 (right) back to 1976 (left)–the last year the world was cooler than average. NOAA Climate.gov image, based on data from NOAA National Centers for Environmental Information.
The planet continued its warming trend in 2022, with last year ranking as the sixth-warmest year on record since 1880, according to an analysis by scientists from NOAA National Centers for Environmental Information (NCEI).
Earth’s average land and ocean surface temperature in 2022 was 1.55 degrees F (0.86 of a degree C) above the 20th-century average of 57.0 degrees F (13.9 degrees C)—the sixth highest among all years in the 1880-2022 record. It also marked the 46th consecutive year with global temperatures rising above the 20th-century average. The 10-warmest years on record have all occurred since 2010, with the last nine years (2014-2022) among the 10-warmest years.
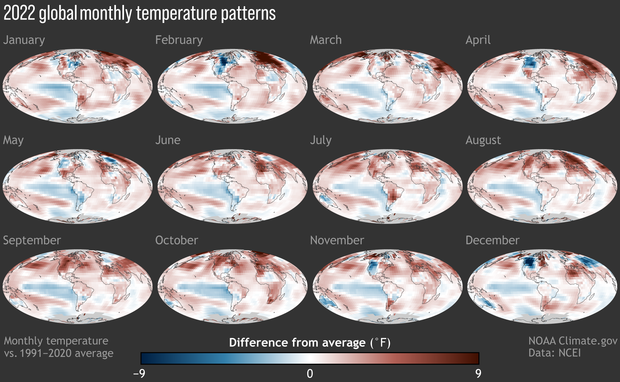
Monthly temperatures in 2022 from January (upper left) through December (bottom right) compared to the 1991-2020 average. Image by NOAA Climate.gov, based on NCEI data.
For more details on last year's global climate, including polar sea ice, tropical cyclones, and ocean heat content, access NOAA NCEI’s year-end 2022 global climate report and images.