2022 U.S. billion-dollar weather and climate disasters in historical context
The NOAA National Centers for Environmental Information (NCEI) has released the final update to its 2022 Billion-dollar disaster report (www.ncei.noaa.gov/access/billions), confirming another intense year of costly disasters and extremes throughout much of the country. 2022 tied 2017 and 2011 for the third highest number of billion-dollar disasters. 2022 was also third highest in total costs (behind 2017 and 2005), with a price tag of at least $165.0 billion. This total annual cost may rise by several billion when we’ve fully accounted for the costs of the December 21-26 Central and Eastern winter storm/cold wave.
A note about images: The images in this post are screenshots from the Billion-dollar Disaster web analysis and mapping tool, which is best viewed on a desktop computer monitor. For best viewing, click to see full-size versions of these images, or visit the NCEI web tool directly.
2022 Highlights
In 2022, the U.S. experienced 18 separate weather and climate disasters costing at least 1 billion dollars. That number puts 2022 into a three-way tie with 2017 and 2011 for the third-highest number of billion-dollar disasters in a calendar year, behind the 22 events in 2020 and the 20 events in 2021. It was another year with a high diversity of destructive disasters:
- 1 winter storm/cold wave event (across the central and eastern U.S.).
- 1 wildfire event (wildfires across the western U.S. including Alaska).
- 1 drought and heat wave event (across the western and central U.S.).
- 1 flooding event (in Missouri and Kentucky).
- 2 tornado outbreaks (across the southern and southeastern U.S.).
- 3 tropical cyclones (Fiona, Ian and Nicole).
- 9 severe weather/hail events (across many parts of the country, including a derecho in the central U.S).
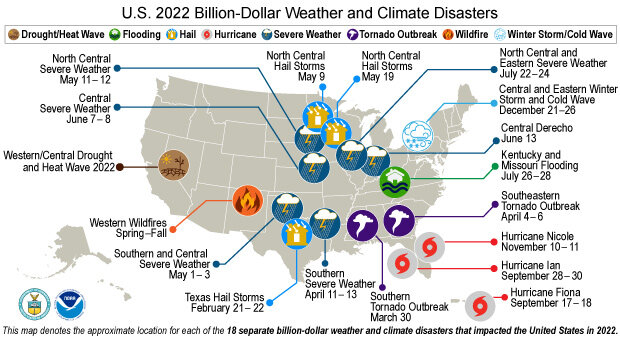
In 2022, the United States experienced 18 separate weather or climate disasters that each resulted in at least $1 billion in damages. NOAA map by NCEI.
2022 was also deadly, in that the 18 events of 2022 caused at least 474 direct or indirect fatalities—the 8th most disaster-related fatalities for the contiguous U.S. since 1980.
Damages from the 2022 disasters totaled $165.1 billion. (All cost estimates are adjusted based on the Consumer Price Index, 2022). The costliest 2022 events were Hurricane Ian ($112.9 billion) and the Western and Central Drought / Heat Wave ($22.1 billion). Adding the 2022 events to the record that began in 1980, the U.S. has sustained 341 weather and climate disasters with the overall damage costs reaching or exceeding $1 billion. The cumulative cost for these 341 events exceeds $2.475 trillion.
2022 costs in historical context
Like many years in the past decade, 2022 was another active year during which we had a high frequency, a high cost, and large diversity of extreme events that affect people's lives and livelihoods—concerning because it hints that the extremely high activity of recent years is becoming the new normal. 2022 (red line) marks the eighth consecutive year (2015-2022) in which 10 or more separate billion-dollar disaster events have impacted the U.S. The 1980–2022 annual average (black line) is 7.9 events (CPI-adjusted); the annual average for the most recent 5 years (2018–2022) is 17.8 events (CPI-adjusted).
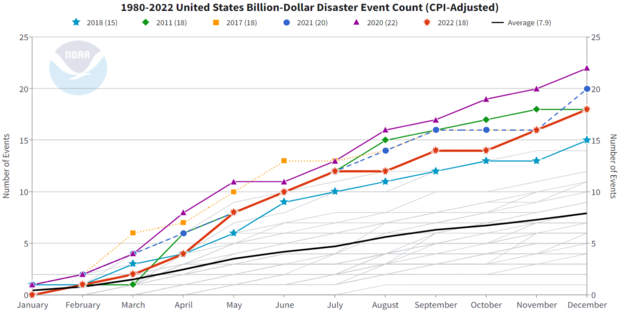
Month-by-month accumulation of billion-dollar disasters for each year on record. The colored lines represent the top 6 years for most billion-dollar disasters. All other years are colored light gray. NOAA image by NCEI.
Over the last seven years (2016-2022), 122 separate billion-dollar disasters have killed at least 5,000 people and cost >$1 trillion in damage. In addition, the $100 billion cost figure has been eclipsed in 5 of the last six years (2017-2022 with 2019 being the exception). One of the drivers of this cost is that the U.S. has been impacted by landfalling Category 4 or 5 hurricanes in five of the last six years, including Hurricanes Harvey, Irma, Maria, Michael, Laura, Ida, and Ian.
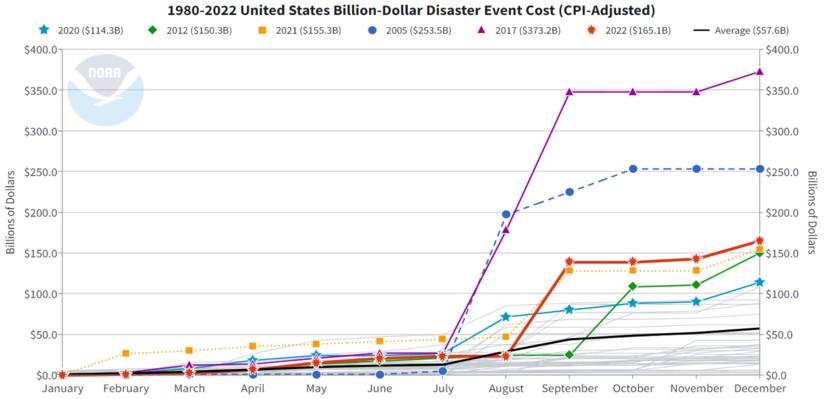
Month-by-month accumulation of estimated costs of each year's billion-dollar disasters, with colored lines showing 2022 (red) and the previous top-5 costliest years. Other years are light gray. 2022 finished the year in third place for annual costs. NOAA NCEI graphic.
In broader context, the total cost of U.S. billion-dollar disasters over the last 5 years (2018-2022) is $595.5 billion, with a 5-year annual cost average of $119.1 billion, the latter of which is nearly triple the 43-year inflation adjusted annual average cost. The U.S. billion-dollar disaster damage costs over the last 10-years (2013-2022) were also historically large: at least $1.1 trillion from 152 separate billion-dollar events.
It is important to keep in mind that these estimates do not reflect the total cost of U.S. weather and climate disasters, only those associated with events more than $1 billion in damages. That means they are a conservative estimate of how much extreme weather costs the United States each year. However, these billion-dollar events do account for most of the damage from all recorded U.S. weather and climate events (NCEI; Munich Re), and they are becoming an increasingly larger percentage of the total damage costs from weather-related events at all scales and loss levels.
The U.S. losses from billion-dollar disasters over the last seven years (2015-2022) are more than $1 trillion and have further skewed the total distribution of extreme weather costs. From 1980-2000, about 75% of all disaster-related costs were due to billion-dollar disasters, and by 2010, the percentage had risen to about 80%. By 2022, it has risen to ~85% of all disaster-related costs, or $2.475 trillion out of $2.850 trillion.
Increasing trend of high-cost disasters: exposure, vulnerability, and climate change
The number and cost of weather and climate disasters are increasing in the United States due to a combination of increased exposure (i.e., more assets at risk), vulnerability (i.e., how much damage a hazard of given intensity—wind speed, or flood depth, for example—causes at a location), and the fact that climate change is increasing the frequency of some types of extremes that lead to billion-dollar disasters (NCA 2018, Chapter 2).
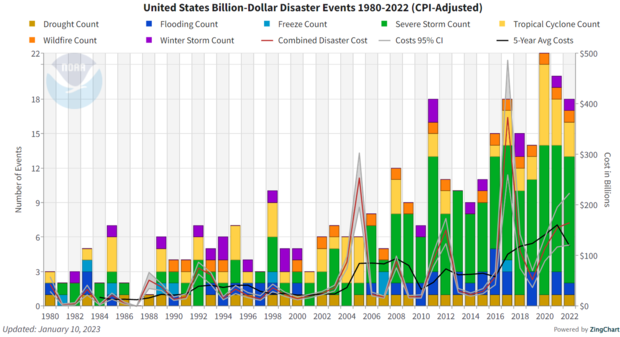
The history of billion-dollar disasters in the United States each year from 1980 to 2022, showing event type (colors), frequency (left-hand vertical axis), and cost (right-hand vertical axis.) The number and cost of weather and climate disasters is rising due to a combination of population growth and development along with the influence of human-caused climate change on some type of extreme events that lead to billion-dollar disasters. NOAA NCEI.
In other words, the increase in population and material wealth over the last several decades are an important cause for the rising costs. These trends are further complicated by the fact that much of the growth has taken place in vulnerable areas like coasts, the wildland-urban interface, and river floodplains. Vulnerability is especially high where building codes are insufficient for reducing damage from extreme events. This is part of the reason that the 2010s decade is far costlier than the 2000s, 1990s, or 1980s (all inflation adjusted to 2022 dollars).
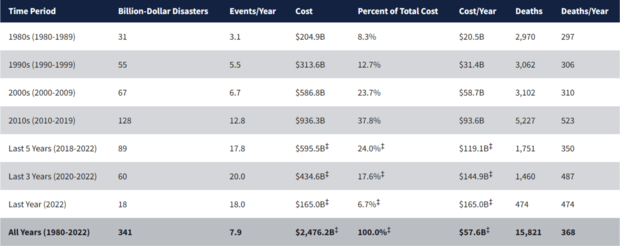
Screenshot of a table of summary statistics of billion-dollar disasters by decade and by latest 1, 3-, and 5-year periods. NCEI Billion-dollar disaster web interface.
However, climate change is also supercharging the increasing frequency and intensity of certain types of extreme weather that lead to billion-dollar disasters—most notably the rise in vulnerability to drought, lengthening wildfire seasons in the Western states, and the potential for extremely heavy rainfall becoming more common in the eastern states. Sea level rise is worsening hurricane storm surge flooding. (Read more about changes in climate and weather extremes in the U.S. National Climate Assessment.) Given all these compounding hazard risks, there is an increased need to focus on where we build, how we build, and investing in infrastructure updates that are designed for a 21st-century climate.
Notable U.S. billion-dollar disasters of 2022
Among the many weather and climate-related disasters to affect the U.S. in 2022, the following caused the most damaging impacts and broke numerous records.
Hurricane Ian (September 2022): $112.9 billion, 152 deaths
Ian made landfall near Cayo Costa, Florida, as a Category 4 hurricane with sustained winds of 150 mph. Significant parts of coastal communities, including those along the barrier islands of Captiva, Sanibel, Pine and Fort Myers Beach, were swept away by the high winds and storm surge. Ian slowly crossed Florida causing significant inland flooding across central and eastern portions of the state from widespread rainfall totals of 10-20 inches. The counties of Volusia, Orange, Seminole and Brevard reported more than 20 inches of rainfall.
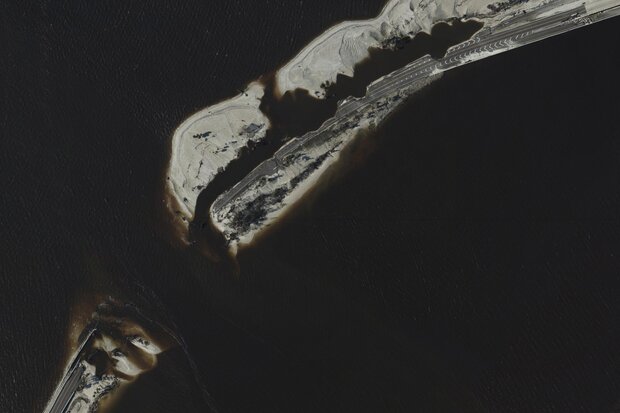
One of multiple washouts on the Sanibel Causeway near Fort Myers, Florida, following the passage of Hurricane Ian in 2022. Image captured September 29; provided by NOAA Remote Sensing Division.
Ian re-emerged over the Atlantic as a tropical storm, re-intensified into a Category 1 hurricane on September 30, and made landfall near Georgetown, SC, with sustained winds of 85 mph causing more coastal flood damage and destroying several large piers near Myrtle Beach, South Carolina. Since 1980, five hurricanes have produced $20+ billion in damage in Florida—Andrew (1992), Charley (2004), Wilma (2005), Irma (2017), and Michael (2018). Hurricanes Andrew and Irma produced the highest damage totals in Florida (approximately $50 billion for each storm). Hurricane Ian's impact is the first to exceed $100 billion in insured and uninsured losses in Florida.
Western and Central Drought / Heat Wave (2022): $22.2 billion, 136 deaths
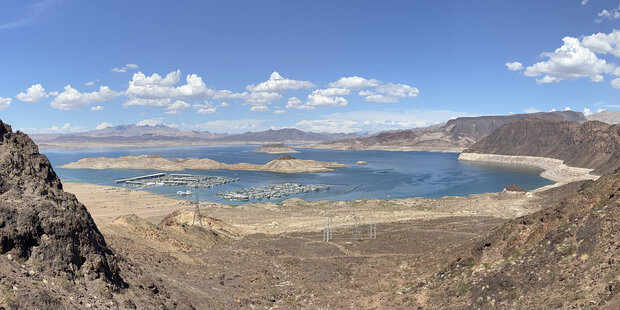
Lake Mead on August 17, 2022. Photo by Christopher Clark, Bureau of Reclamation. Used under Creative Commons license.
Severe drought conditions impacted the Western and Southern Plains states. Large reservoirs across the West including Lake Mead, Lake Powell, Lake Oroville, and Shasta Lake, among others, continue to be depleted. Lake Mead, the Nation's largest reservoir, is nearing dead pool status and is at the lowest level since it was filled in the 1930s. The Great Salt Lake is also near record-low levels. The impacts of the drought are affecting crops and feed costs for livestock. Extreme heat also developed for many days across Western and Central states causing more than one hundred heat-related fatalities across Arizona, Nevada, California, Oregon and Texas. This is one of the more costly droughts on record, with a diverse array of direct impacts across different regions and industries.
1980-2022 costs and fatalities by disaster type
The distribution of damage from U.S. billion-dollar disaster events from 1980 to 2022 is dominated by tropical cyclone losses. Tropical cyclones have caused the most damage ($1,333.6 billion) and have the highest average event cost ($22.2 billion per event). Drought ($327.7 billion), severe storms ($383.7 billion), and inland flooding ($177.9 billion) have also caused considerable damage based on the list of billion-dollar events.
Severe storms have caused the highest number of billion-dollar disaster events (163), but they have the lowest average event cost ($2.4 billion). Tropical cyclones and flooding represent the second and third most frequent event types (60 and 37), respectively. Tropical cyclones are responsible for the highest number of deaths (6,890), followed by drought/heatwave events (4,275) and severe storms (1,982).
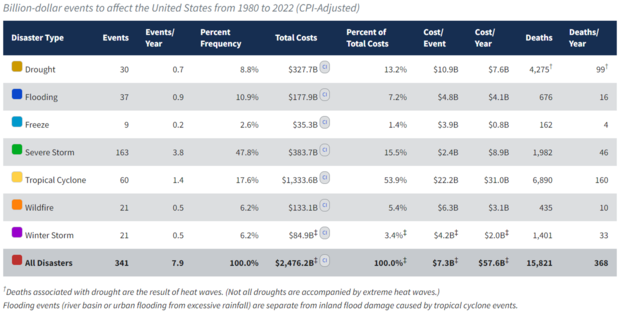
This table shows the breakdown, by hazard type, of the 341 billion-dollar weather and climate disasters assessed since 1980. Screenshot from the NOAA NCEI Billion-dollar Disasters webpage.
Climatology of billion-dollar disasters
Disasters by region
The South, Central and Southeast regions of the United States, including the Caribbean U.S. territories, have suffered the highest cumulative damage costs, reflecting the severity and widespread vulnerability of those regions to a variety of weather and climate events. In addition to the highest number of billion-dollar disasters experienced, Texas also leads the U.S. in total cumulative costs (~$380 billion) from billion-dollar disasters since 1980. Florida is the second-leading state in total costs since 1980 (~$370 billion), largely the result of destructive hurricane impacts.
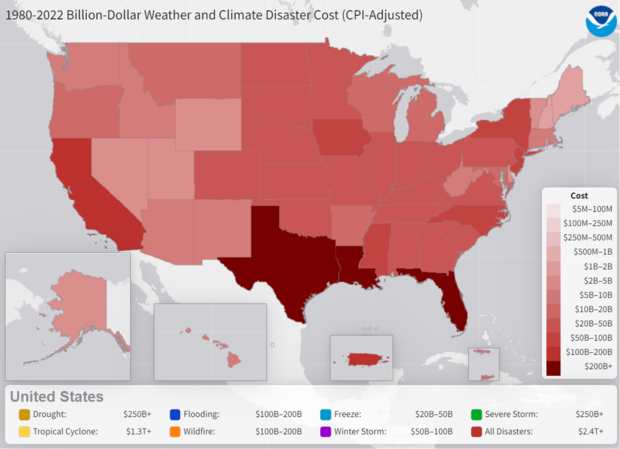
This map depicts the total estimated cost borne by each state from billion-dollar weather and climate events from 1980-2022. Screenshot from NOAA NCEI Billion-dollar Disasters web mapping tool.
Louisiana’s total costs are now the 3rd highest (~$290 billion) from billion-dollar disasters (after being surpassed by Florida this year due to the impacts from Hurricane Ian). This year Florida experienced landfalling Hurricanes Ian and Nicole in the span of only four weeks. There were numerous cities and towns that were beginning the disaster recovery process after Ian, only to experience more damage from Nicole.
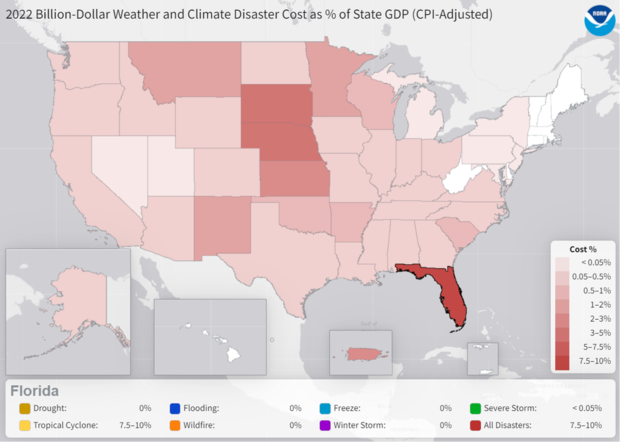
Screenshot of a map the US showing billion-dollar disasters costs for each state during 2022 as a percentage of each state's 2022 gross domestic product (GDP). NOAA NCEI image from the Billion-dollar Disaster web mapping tool.
Another way to examine damage is to compare each state’s annual disaster losses relative to their Gross Domestic Product (GDP), which represents economic output. The damage costs from Hurricane Ian across Florida were impactful during 2022 reflecting 7.5-10.0% of Florida’s 2022 economic output (GDP). Several other states across the nation also sustained relatively large hazard impacts from other extremes including drought / heat and severe storms including hail, derechos and tornadoes.
Billion-dollar disasters by month
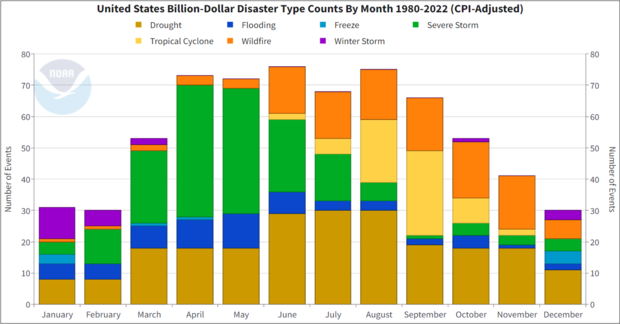
The monthly climatology of U.S. billion-dollar weather and climate disasters from 1980 to 2022, showing which months have the greater frequency of disasters (height of bar) and which types of events (colors) are most likely to occur in a given month. NOAA NCEI image.
The 43-year climatology of U.S. billion-dollar disasters offers a view of risk from extreme events, which are often seasonal in nature. For example, during the spring months (March-May) severe storms (green blocks),including tornadoes, hail, and high winds, often occur in many Central and Southeast states, but they taper off in the second half of the year. During the spring months there is also greater potential for major river flooding (i.e., deep blue events in chart above). U.S. springtime flooding from snowmelt and/or heavy rainfall is a persistent hazard that affects many towns and agriculture regions within the Missouri and Mississippi River basins, among others.
During the fall season, Gulf and Atlantic coast states must be vigilant about hurricane season particularly during August and September (i.e., yellow events in chart above). Hurricanes are the most destructive and costly of these events totaling damage losses exceeding $1 trillion since 1980. For example, in 2016-2018, the U.S. was impacted by 6 separate billion-dollar hurricanes (i.e., Matthew, Harvey, Irma, Maria, Florence, Michael) with 3,318 fatalities and an inflation-adjusted loss total of $390.8 billion. As a comparison, the U.S. also experienced a series of active hurricane seasons from 2003-2005 where 9 separate billion-dollar hurricanes (including Katrina, Rita, and Wilma in 2005) made landfall, with 2,225 fatalities and an inflation-adjusted loss total of $343.2 billion.
Also, the peak of the Western U.S. wildfire season occurs during the fall months of September, October and November (i.e., orange events in chart above). California, Oregon, Washington, Idaho, Montana and Colorado often experience enhanced wildfire risk and related poor air quality for weeks to months. Western wildfire risk is also becoming more hazardous, as 17 of the 20 largest California wildfires by acreage and 18 of the 20 most destructive wildfires by number of buildings destroyed have occurred since the year 2000. In four of the last six years (2017, 2018, 2020 and 2021), California has experienced historically large and costly wildfires with losses well exceeding $65.0 billion. Overall, the 2022 Western wildfire season was less severe and destructive than in recent years.
In total, each region of the U.S. faces a unique combination of recurring hazards, as billion-dollar disaster events have affected every state since 1980. The chart above highlights how the frequency of billion-dollar disasters differs across both time and space. The combined historical risk of U.S. severe storms and river flooding events places the spring and summer seasons in the high-risk category for simultaneous extreme weather and climate events. Hurricane, wildfire and drought impacts dominate the Fall season.
The winter months are also active with the potential for powerful winter storms and cold wave events, much like what two-thirds of the U.S. experienced from December 21-26, which killed at least 87 people and caused billions of dollars in damage.
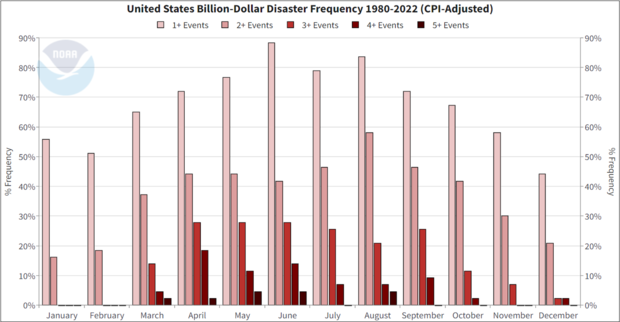
This graph shows the percent frequency of a given month having at least one billion-dollar disaster (light pink bars), 2 or more events (medium pink bars), 3 or more (red), 4 or more (darker red), or 5 or more (darkest red). Billion-dollar weather and climate disasters occur in all months, but the spring and summer (March–Aug) are the time when multiple, concurrent disasters are likely. A second maximum occurs in the Fall driving by tropical cyclones. Screenshot from the NCEI Billion-dollar Disasters webpage.
The increase in disasters create 'compound extremes' (e.g., billion-dollar disaster events that occur at the same time or in sequence), which are also an increasing problem for recovery. As noted in National Climate Assessment (2017) "the physical and socioeconomic impacts of compound extreme events (such as simultaneous heat and drought, wildfires associated with hot and dry conditions, or flooding associated with high precipitation on top of snow or waterlogged ground) can be greater than the sum of the parts."
For example, in 2021 California experienced drought-enhanced wildfire seasons that produced wildfires and mountain-side burn scars, followed by atmospheric rivers of heavy rainfall that enhanced landslides and flooding. Other examples include southern Louisiana being impacted by multiple hurricanes and Spring flooding events in 2020 and 2021. In 2022, Florida was impacted by Hurricanes Ian and Nicole in the span of several weeks.
Over the last six years (2017-2022), there were just 18 days on average between billion-dollar disasters compared to 82 days in the 1980s. Shorter time intervals between disasters often mean less time and resources available to respond, recover and prepare for future events. This increased frequency of events produces cascading impacts that are particularly challenging for vulnerable socioeconomic populations.
Mapping County Level Hazard Risk, Vulnerability, and Projected Future Impacts
To better reflect multi-hazard and socioeconomic risk – the Billion-dollar disaster site has continued to develop its mapping tools at both the county and Census tract-level. This provides neighborhood-scale information on natural disaster and socioeconomic vulnerability and resilience to hazards across the United States.
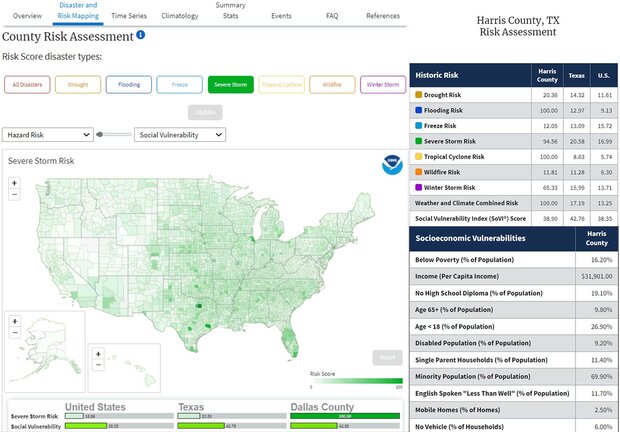
NOAA's county-level risk mapping tool allows users to view risk scores based on historical and projected occurrence of billion-dollar disasters, and how those scores overlap with social vulnerability based on population age, income, and other factors. Screenshots from NOAA NCEI Billion-dollar disaster mapping tool.
This interactive NOAA mapping tool provides detailed information on a location’s susceptibility to weather and climate hazards that can lead to billion-dollar disasters—such as wildfires, floods, drought and heat waves, tornado outbreaks, and hurricanes. The tool expands upon FEMA’s National Risk Index and the Census American Community Survey to provide a view of a location’s risk for, and vulnerability to, single or multiple combinations of weather and climate hazards for every county and county-equivalent in all 50 states and the District of Columbia.
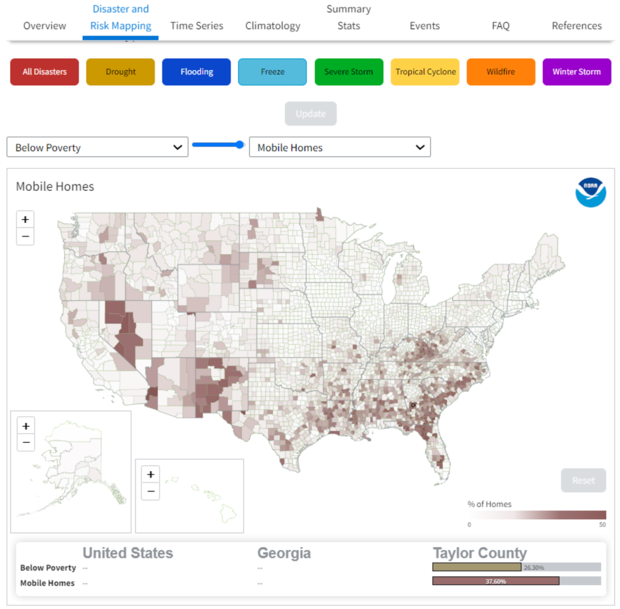
The most recent update to NOAA's Billion-dollar Disasters mapping app allows users to find local-scale data on overlapping hazards and socioeconomic vulnerabilities. Screenshot from NCEI's hazard mapping tool.
This is a new focus on multi-hazard risk mapping at local scales, highlighting areas of socioeconomic vulnerability where communities may be most impacted are less served. As we have seen in recent years, many parts of the country are prone to hazards and their impacts such as the Western megadrought and longer, more intense wildfire seasons to the strong hurricanes that have frequently impacted Florida and Louisiana in recent years. FEMA and NOAA tools along with many new tools from across the Federal agencies help us better examine the exposure, vulnerability and resilience to many different hazards so that we can better plan and prepare for the future: https://www.ncei.noaa.gov/access/billions/mapping
Comments
Government costs vs public costs
About 60% of the 2.5 trillion dollar costs are government costs? I have found no reference for the impact of SW on the federal debt, or the annual historic costs incurred. Are there any reports/references available?
Not sure about your statistic
NCEI's billion dollar disaster analysis doesn't (AFAIK) break down costs for different sectors (government, private, corporate, etc). So I can't offer you any reports to corroborate the statistic that you ask about, because the post doesn't make any claims like that. Sorry if I am not understanding what you are asking!
Are these data described in any reports?
It would be very useful for hazard mitigation planning if these data are described in a report. For example, among $1B weather/climate events in South Dakota, well over half the damages come from drought. Very interesting, but it's unclear what can be done about that. Where does the $1B come from? Is it all agricultural loss? If so, what types of agricultural loss.
So, are these data described in a report that we can evaluate further?
Unintended Consequences with direct causation
Is there a category for directly related deaths due to the impacted climate events unintended consequences? Like a States gross mismanagement of disaster relief funding that left newly homeless victims neglected, unattended and unhoused, directly leading to their demise.
Where is this tool?
The link to the tool shows the State data. where is the tool for county level datasets?
Risk mapping tool
It looks like they have modified the interface slightly since we published that article. There used to be a single tab "disaster and risk mapping" but now there are separate tabs. "disaster mapping" is at the state level; "risk mapping" is at the county level.
Comments have been disabled on this article