Beyond the Data Blog
NOAA’s National Centers for Environmental Information (NCEI) tracks U.S. weather and climate events that have great economic and societal impacts (www.ncdc.noaa.gov/billions). Since 1980, the U.S. has sustained 203 weather and climate disasters where the overall damage costs reached or exceeded $1 billion (including adjustments based on the Consumer Price Index, as of January 2017). The cumulative costs for these 203 events exceed $1.1 trillion.
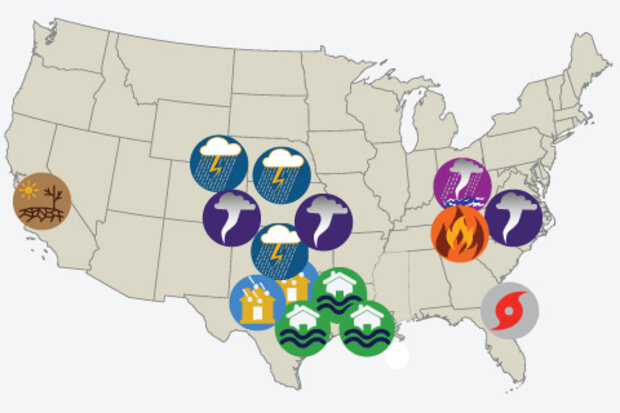
The year 2016 was an unusual year, as there were 15 weather and climate events with losses exceeding $1 billion each across the United States. These events included drought, wildfire, 4 inland flood events, 8 severe storm events, and a tropical cy…
Read article
In this edition of Beyond the Data, we’ll look back at 2016 and identify some of the most meaningful climate and weather events from the year.
First, the disclaimers
This is not a “top five” list of the biggest weather and climate events of the year. There are plenty of those running around. It’s simply one climate scientist’s view about selected important climate happenings of 2016, and why they speak to our understanding and experience with long-term climate.
Warmest year (probably) on record, globally.
What happened:
It was another important year for what is perhaps the most overused climate change indicator out there: globally-averaged surface temperature. This metric is v…
Read article
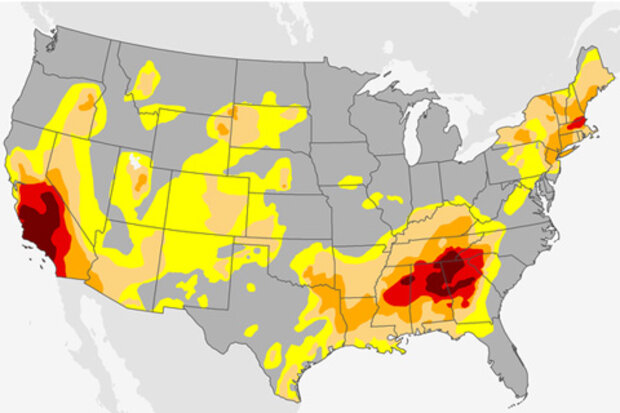
Drought has erupted in the Southeast United States in recent months, and emerged in the central plains in recent weeks. Forest fires have dotted the Southern Appalachians. Areas not directly threatened by the fires have dealt with the downstream consequences. Many places—including here in Asheville—have seen an almost uninterrupted run of air quality alerts. My part of the country now faces some of the same challenges many Californians have been battling for several years.
How we got there
The short version of how we got there, and this isn’t meant to sound flippant, is that it’s been dry and warm.
Take a look at October’s “percent of normal” precipitation map. The darke…
Read article
Last week’s Beyond the Data post examined the extreme temperature climates in the United States, as defined by station “normals.” We promised to come back and look at the precipitation extremes, and here we are.
First, a reminder: this information, for a subset of about 450 stations across the United States, is available through this tool. We’ve left the settings at the default “don’t give me stations within 20 miles of each other” setting. Jump in and play with the data yourself!
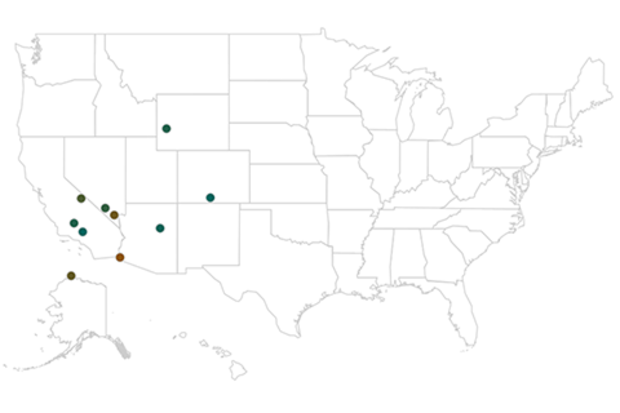
The Wettest and Driest Places in America
The tables below list the ten wettest and ten driest locations in the United States. Again, these are annual normals, or what would be expected in the mythica…
Read article
We’ve been going Beyond the Data for a year and a half now (time flies!). Sometimes, on a long journey, it’s good to revisit the basics. What got us here?
That’s the theme for this edition. We’re going old school, and just look at some good old climatology adages and truisms, through the lens of a sturdy, reliable warhorse of a dataset.
One question that we get here at NCEI’s Center for Weather and Climate, more so than you might think, are questions about superlatives. “What is the hottest place in America?” and so on. I call these the “Mostest Questions.”
To respond to these recurring questions, we set up a handy viewer that helps describe just that. Today’s edition of Beyond the …
Read article