Beyond the Data Blog
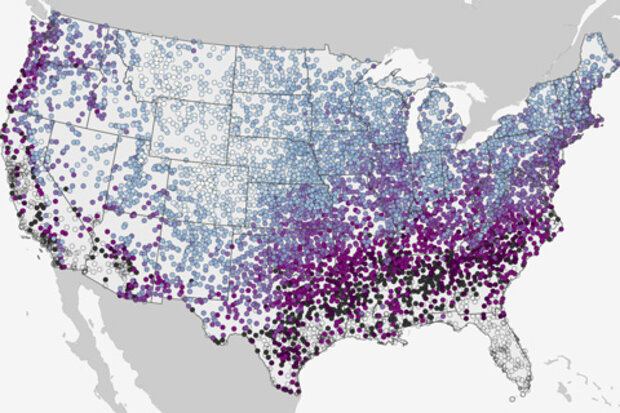
Near the anniversary of Beyond the Data's most popular post, we've given the map an interactive upgrade. Click to zoom in on an area of interest and drill down to see the date by which the chances for the first snow of the season at your location rise to at least 50%. Will this year's first snow come earlier or later than the historic "first date" of snow? See what the climate record has to say and keep up with your local forecast.
This map shows the historic date by which there’s a 50% chance of at least 0.1” of snow on the ground, based on each location’s snowfall history from 1981-2010, based on the latest U.S. Climate Normals from NOAA's National Centers for Environmental Informat…
Read article

By now, you’ve probably heard that July was the warmest month on record for the planet’s surface. We live in a warming world and with that comes a surge in global-scale temperature. In my office, though, we often remind each other that nobody was harmed by “global average temperature.” It’s an important indicator of change, to be sure, but the consequences of a warming world show up locally.
One such consequence came to light in July, the warmest month of Earth’s recent history: an anthrax outbreak in western Siberia. The outbreak was traced, at least preliminarily, to a reindeer carcass that had thawed after being frozen for several decades.
I won’t pretend to know all the details or …
Read article
It might seem strange to be talking about Northern Hemisphere Snow cover during the heat of summer, but July 1st was “Snow New Year”: the end of the 2015-16 meteorological snow year and the start of the 2016-17 “snow year.” As most people do at the start of a new year, we’re reflecting on events from the past year to understand where we have been and where we might be going. In this Beyond the Data blog post, we will dig deeper into the Northern Hemisphere snow cover extent during the 2015-16 snow season and explore change in snow cover over time.
History of snow mapping
To understand Northern Hemisphere snow cover extent, it helps to examine its history. Thanks to the hard work …
Read article
What a difference the day makes
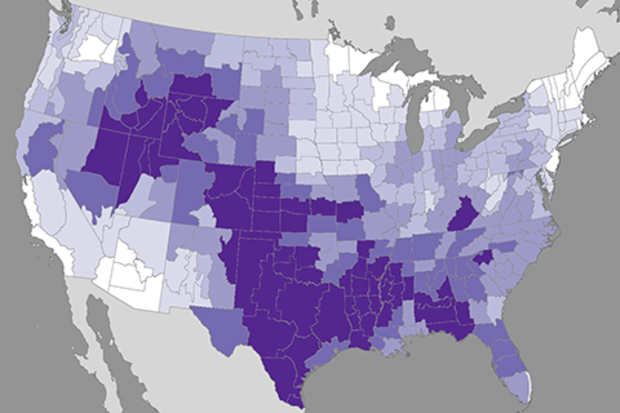
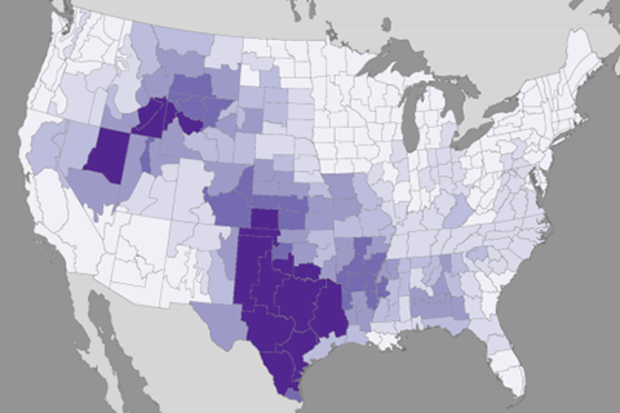
In the last Beyond the Data entry, we investigated the role that late-spring rainfall plays in summer temperatures. The short, short version:
For much-to-most of the contiguous United States (CONUS), summer temperatures have a relationship with (they “listen to”) late spring precipitation. Wetter places in June tend to be cooler through summer, but the tendency is slight. The relationship is not very strong to begin with, explaining about a quarter of the variance, and diminishes to zero away from the south and interior parts of the CONUS.
I subsequently got a note from a great colleague from back in my state climate office days. Jim Angel, the Illino…
Read article
In climate monitoring, we often use the term “outcome” to describe the results of a season. For example, “For most of the United States, seasonal outcomes during spring 2012 included a record-warm March and a record-warm spring.”
Outcomes in climate—like in life—are a combination of factors. And at certain times of year—like certain times in life—different factors emerge as relatively more important to an outcome. In climate, spring dampness is one of those factors that emerges as important for warm season outcomes, particularly for the interior of the continent.
This week, we’ll go Beyond the Data to examine how spring precipitation influences summer temperatures, and why this mat…
Read article