Blogs
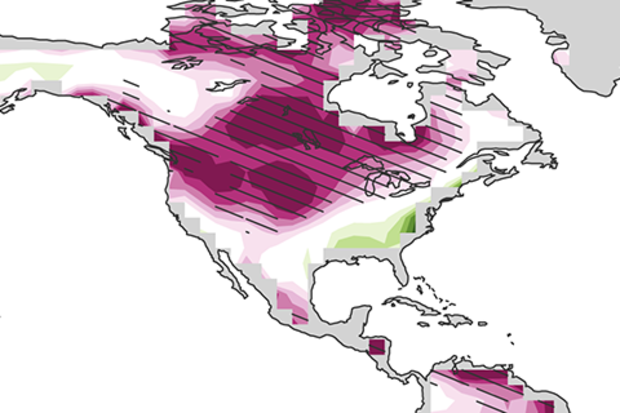
There’s no doubt ENSO is a major heavyweight in the battle to dominate the world’s climate, which is why we obsess over conditions in the tropical Pacific Ocean. But there are other climate drivers that spend time in the ring and have their moments of glory. Here, we will cover some exciting new research that suggests that the land surface, and in particular soil moisture, can sometimes impact atmospheric flows across thousands of miles!
One of the great pleasures of working at the NOAA Climate Prediction Center is that some scientists are interested in visiting us and introducing us to the latest ideas in climate research. Dr. Haiyan Teng of the National Cente…
Read article
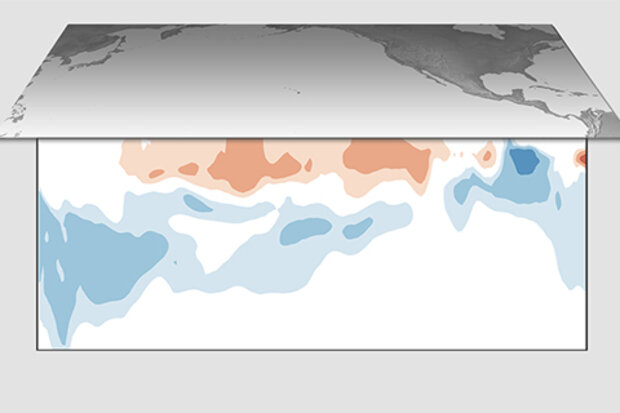
El Niño is hanging on by its fingernails, but forecasters predict this event will wind down within the next couple of months. It’s likely that the temperature of the tropical Pacific Ocean surface will return to near-average soon, qualifying for “ENSO-neutral” conditions. Neutral conditions are favored to remain through the fall and winter.
Not dead yet
The June Niño3.4 index, our primary ENSO measurement, was 0.6°C above the long-term average, just above the El Niño threshold of 0.5°C. There is some evidence that the atmosphere over the central Pacific is still responding to that extra heating, as a bit more clouds and rain than average were present in June.
The Southern Oscillatio…
Read article
As meteorologists and climate scientists, we talk about, think about, and commiserate about forecasts a lot. One enhancement that NOAA’s ENSO forecasting team has been working toward is the prediction of the strength of El Niño or La Nina. And judging by the comments left on social media or under our articles, that’s something you want from us too.
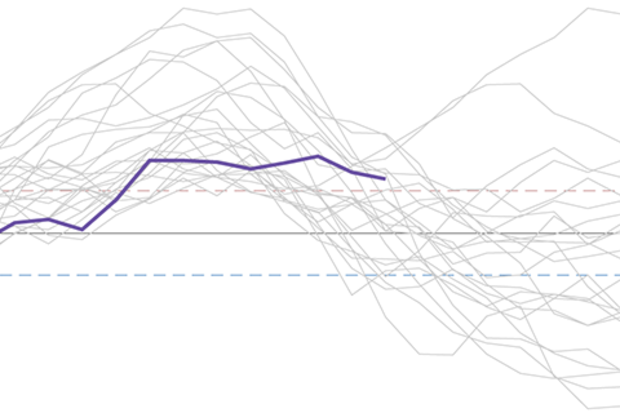
It was with that in mind that the ENSO blog’s own Michelle L’Heureux and colleagues set up an experiment for the ENSO forecasting team. She documents the results in a recent journal article (which I am seventh author on (1)). The experiment demonstrated that skillful strength forecasts were feasible, and also something else. It also reveal…
Read article
Raining on your parade
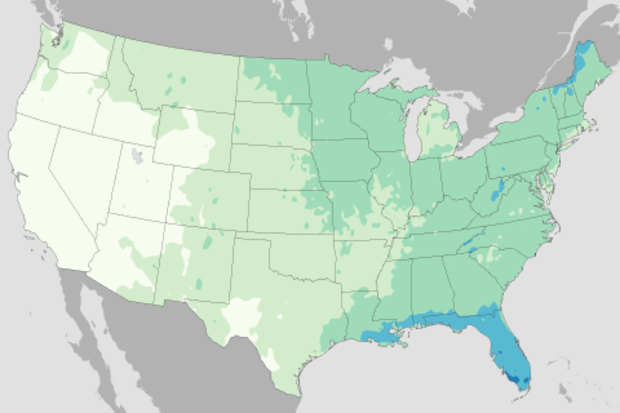
NOAA’s National Weather Service will soon be issuing forecasts for Independence Day (find your local forecast), but here’s a look at the historical probability that your Fourth of July picnic will be rained on, based on observations from 1981-2010.
If all we had to go on was history, this map says the best chances of clear skies in the contiguous United States (CONUS) would be found, not surprisingly, in the West. Based on past Fourths of July, chances for rain are 10 percent or less for a large area from interior Washington to northwest New Mexico. In the CONUS, the highest chances for rain on your parade would be in southern Florida (40-50%), foll…
Read article
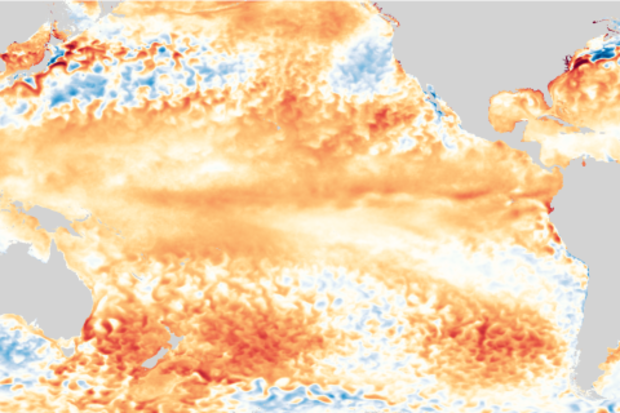
Our El Niño is still hanging around, and forecasters think it’s likely to stay through the summer. What happens after that is less clear, though, with about a 50% chance of El Niño continuing through the fall and winter.
Things as they are
The sea surface temperature across much of the tropical Pacific is still warmer than average, with the Niño3.4 Index coming in at 0.64°C above average during May (via ERSSTv5).
The atmosphere also reflected weak El Niño during May, and both the Southern Oscillation Index the Equatorial Southern Oscillation Index were moderately negative. When these indexes are negative, it means the surface air pressure over the far western Pacific is higher t…
Read article