Blogs
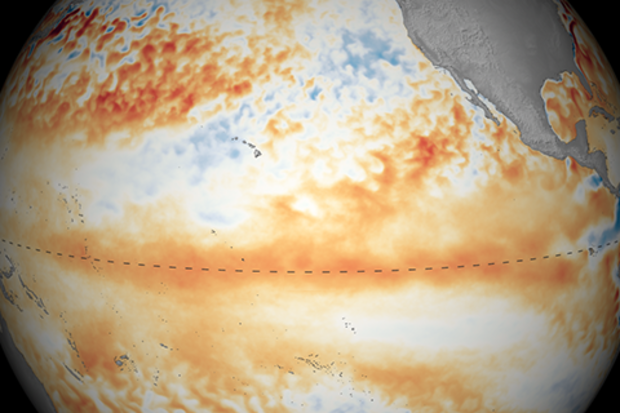
The Great Puny El Niño of 2018–19 continued through March, and forecasters predict it will likely remain through the summer and possibly continue into the fall. The tropical Pacific Ocean shows El Niño’s fingerprint clearly, with warmer-than-average sea surface temperatures stretching across the equator.
Birds fly here
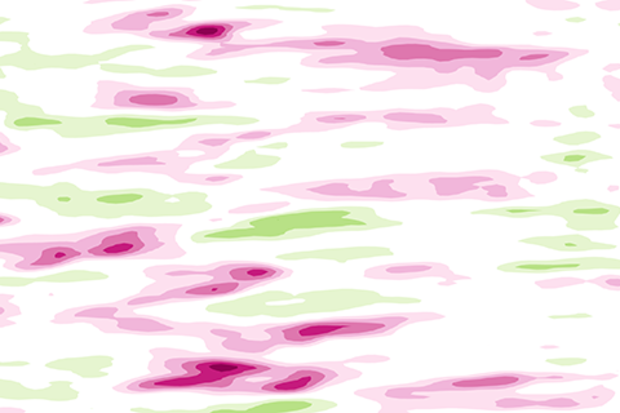
The El Niño atmospheric response was also apparent in March, with continued greater-than-average cloudiness and rain near the International Date Line. This is the weakened Walker Circulation pattern, due to more rising air than average over the central Pacific as the warmth of the ocean is transferred to the air above. Both the regular-flavor Southern Oscillation In…
Read article

Winter is over. Some of you may be thinking “About time!” For others, it may be “When did it start?” And for a select few, it’s “Tell that to the snow outside my window.” With the season having ended, it is time for my annual review (see previous reviews here and here) of how NOAA’s Climate Prediction Center’s Winter Outlook did.
This will involve some necessary math, so feel free to brush up via one of the plethora of posts I’ve written previously—located here, here, here, and here—dealing with just how we verify the outlook. As a quick refresher, remember that the underlying basis for seasonal forecasts is that, in the absence of any strong influence to the contrary, the default probabi…
Read article
Our much-delayed weak El Niño continued into March, and forecasters give it an 80% chance to continue through the spring, with a 60% chance of continuation through the summer.
Spring showers
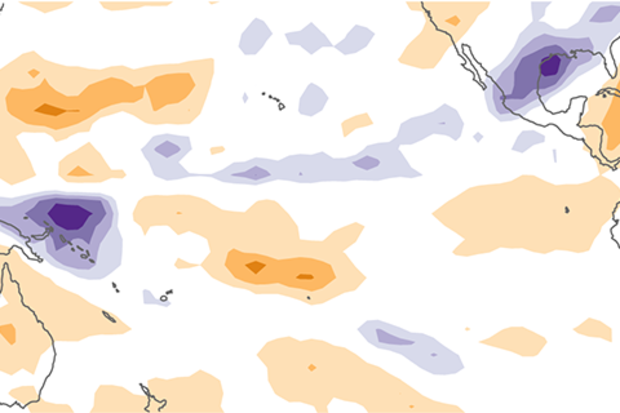
As you may remember from February’s update, the atmosphere finally started showing signs of a response to the warmer-than-average sea surface temperatures in the central tropical Pacific, leading the forecast team to issue an El Niño Advisory. More rain and clouds than average formed over the warmer waters of the central Pacific, less over Indonesia, and near-surface winds in the central Pacific slowed. These patterns continued over the past few weeks, with the dry-Indonesia/rainy-central-Pacific p…
Read article
As Emily’s most recent post describes, the tropical Pacific Ocean and atmosphere have finally coupled, allowing NOAA to declare that weak El Niño conditions are present. It’s nice to see the atmosphere and ocean in a cooperative mood, but ENSO forecasters are left with a mystery: why did the expected atmospheric response go missing for so long? In this blog post, we’ll put our detective hats on and look for clues.
Surveying the crime scene
As you may recall from previous posts on this blog, by fall of 2018, the tropical eastern Pacific sea surface had warmed above the 0.5°C threshold necessary (but not sufficient!) for NOAA to declare El Niño conditions. However, the tropical atmo…
Read article
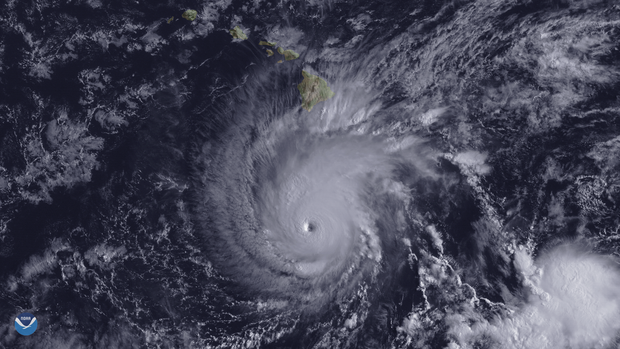
As Adam Smith wrote about in his recent billion-dollar disasters post, 2018 saw an unusual number of amazing—and deadly—weather events. Some had national coverage, especially Hurricanes Florence and Michael and their impacts on the eastern U.S., and the drought and heat triggering record fires in California and other parts of the western U.S.
Many networks across the U.S. collect air temperature and precipitation observations we use to characterize these events. As the nation’s official climate scorekeepers, scientists at NOAA’s National Centers for Environmental Information (NOAA NCEI) receive, quality control, store, and make these data accessible to the public.
Almost all of tho…
Read article